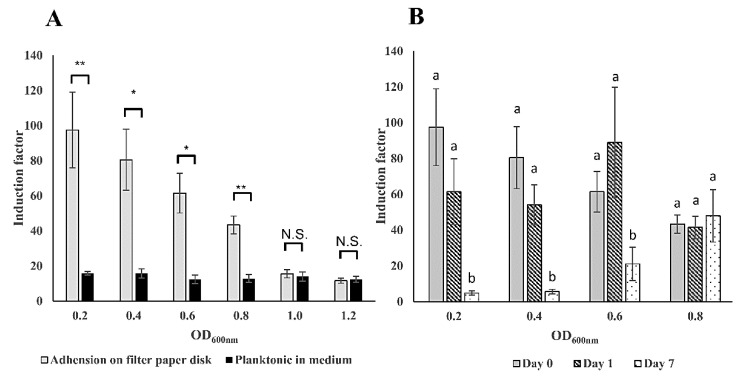
Figure 4.
Sensitivity and stability of the immobilized bacteria cells on filter membrane disks. (A) Comparison of the sensitivity to 2% (v/v) ethanol between filter membrane adhered and planktonic forms of E. coli luminescent strain TV1061 in different optical densities at OD600 nm. (B) Stability of the sensitivity to 2% (v/v) ethanol during storage of filter membrane adhered E. coli strain TV1061 at −20 °C for one day and seven days. All the values in the graphs are presented as mean ± standard error of the mean (SEM), with “*” for p < 0.05, “**” for p < 0.01, and “N.S.” for “Not Significant” (p > 0.05), which were calculated by using the student’s t-test. Different letters above the bars indicate significant differences (p < 0.05) that were tested by the Fisher’s Least Significant Difference.

