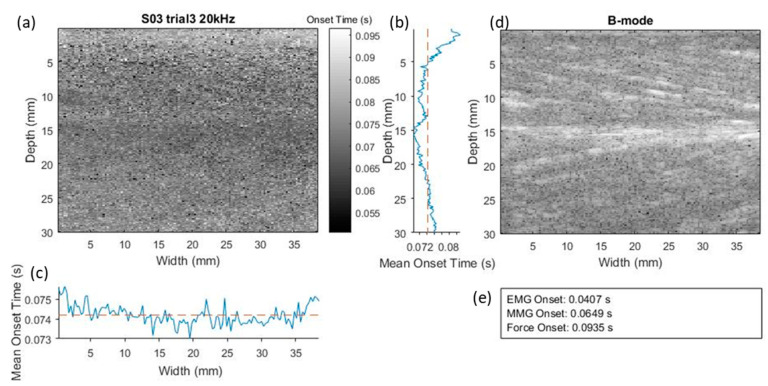
Figure 3.
As example illustrating the ultrasound SMMG onset map (a), B-mode ultrasound image of muscle along longitudinal view (d) and the EMG, MMG, force onset time (e) recorded in a trial. In the mean onset time plots, the blue solid line represents the mean onset time measured using SMMG along the muscle depth direction (b) and longitudinal direction (c), while the orange dotted line represents the overall mean onset time measured with SMMG.

