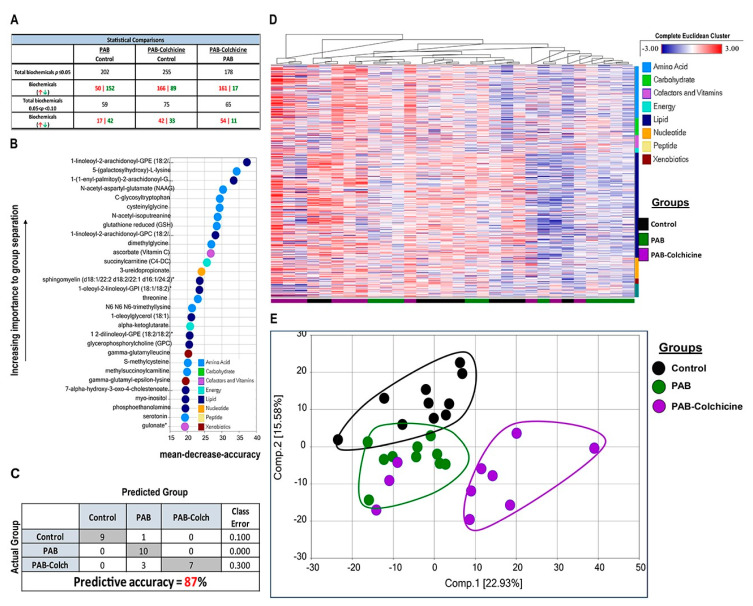
Figure 4.
Effect of colchicine treatment on metabolomic signature in PAB rats. (A) Table depicting the overall differences in metabolites in control, PAB, and PAB-Colch right ventricles. (B) Biochemical importance plot revealing the top 30 ranking biochemicals that differentiates experimental groups. (C) Random Forest Confusion Matrix shows analysis of metabolomics data results in an 87% predictive accuracy. (D) Hierarchical clustering analysis of metabolites. (E) Principal component analysis of total metabolomic data reveals colchicine did not normalize the metabolic signature in PAB rats. Tissue was harvested 8 weeks after sham or PAB procedure.

