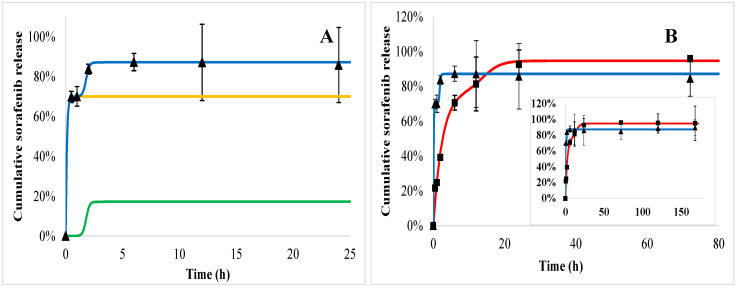
Figure 10.
Sorafenib cumulative release from PEGylated PHB nanoparticles measured in blood plasma (trigons) and acid (squares). The fitted release profiles in plasma (blue) and in acid (red) are also drawn. The modeled release profiles are shown as follows: the release kinetics in acid (A) was built from the initial burst (yellow line) and polymer degradation (green line). In the insert (B), the measured data and the fitted release profiles can be seen on the whole time scale.

