
Table 1.
Antileishmanial, antitrypanozomal and cytotoxic activity of the synthesised derivatives, compared to the positive controls Benznidazole and Miltefosine. The IC50 values are given in mM as average data, with the standard deviations from at least three independent experiments. See Experimental for details about the assays.
| ||||||||||||
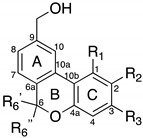
| Mol. | R6′ | R6′’ | R1 | R2 | R3 | T. cruzi | L. brasiliensis | L. amazoniensis | Cytotoxicity a | |||
| IC50 (μM) | SI b | IC50 (μM) | SI b | IC50 (μM) | SI b | IC50 (μM) | ||||||
| 1 | Me | Me | H | OMe | H | 18.5 ± 9.6 | 1.7 | 59.2 ± 11.8 | 0.5 | 77.7 ± 5.5 | 0.4 | 30.7 ± 1.1 |
| 8a | H | H | H | OMe | H | 66.0 ± 18.2 | 1.3 | 248.1 ± 54.1 | 0.3 | 132.1 ± 29.3 | 0.6 | 82.6 ± 9.5 |
| 8b | Me | H | H | OMe | H | 35.9 ± 11.7 | 1.0 | 156.1 ± 23.4 | 0.2 | 156.1 ± 58.5 | 0.2 | 37.1 ± 3.9 |
| 8c | H | Me | H | OMe | H | 67.1 ± 31.2 | 0.8 | 128.8 ± 24.6 | 0.4 | 71.8 ± 12.5 | 0.7 | 52.7 ± 9.0 |
| 8d | Et | H | H | OMe | H | 51.8 ± 9.2 | 0.6 | 45.9 ± 20.3 | 0.7 | 71.4 ± 1.1 | 0.4 | 30.0 ± 3.7 |
| 8e | H | Et | H | OMe | H | 37.0 ± 0.7 | 1.2 | 45.1 ± 19.2 | 1.0 | 70.3 ± 3.7 | 0.6 | 44.4 ± 11.5 |
| 8f | Et | Et | H | OMe | H | 10.4 ± 0.3 | 4.2 | 46.9 ± 5.0 | 0.9 | 36.9 ± 3.4 | 1.2 | 43.6 ± 15.1 |
| 8g | Bu | Bu | H | OMe | H | 22.8 ± 8.5 | 1.5 | 29.3 ± 1.4 | 1.2 | 25.4 ± 1.1 | 1.4 | 35.3 ± 17.5 |
| 10a | Me | Me | H | H | OMe | 88.4 ± 12.2 | 0.7 | 37.4 ± 1.1 | 1.6 | 66.6 ± 7.4 | 0.9 | 59.2 ± 25.9 |
| 10b | Me | Me | OMe | H | H | 92.5 ± 14.8 | 0.5 | 48.1 ± 18.5 | 1.0 | 179.8 ± 21.9 | 0.3 | 48.1 ± 18.5 |
| 10c | Me | Me | H | Me | H | 31.5 ± 7.9 | 1.3 | 39.3 ± 2.4 | 1.0 | 64.9 ± 12.6 | 0.6 | 39.3 ± 1.6 |
| 10d | Me | Me | H | H | Me | 33.0 ± 3.9 | 1.1 | 40.1 ± 8.3 | 0.9 | 51.9 ± 13.8 | 0.7 | 35.4 ± 7.9 |
| 10e | Me | Me | H | H | H | 50.8 ± 6.2 | 1.2 | 74.9 ± 16.6 | 0.8 | 91.6 ± 5.4 | 0.7 | 62.4 ± 6.2 |
| 10f | Me | Me | H | i-Pr | H | 12.4 ± 3.5 | 0.7 | 18.1 ± 0.7 | 0.5 | 15.6 ± 2.8 | 0.6 | 8.9 ± 3.5 |
| 10g | Me | Me | H | H | i-Pr | 14.2 ± 4.2 | 1.6 | 19.1 ± 1.1 | 1.1 | 21.2 ± 7.1 | 1.0 | 22.0 ± 7.1 |
| 10h | Me | Me | H | n-Pen | H | 6.4 ± 0.3 | 2.0 | 16.4 ± 0.3 | 0.8 | 16.8 ± 1.9 | 0.8 | 12.9 ± 3.2 |
| Benznidazole | 19.2 ± 7.7 | 3.9 | - | - | - | - | 74.7 ± 9.1 | |||||
| Miltefosine | - | - | 13.0 ± 1.2 | 5.9 | 10.8 ± 1.5 | 7.1 | 76.6 ± 3.2 | |||||
a Toxicity was measured on RAW cells, see Experimental for details, b SI, selectivity index (cytotoxicity/anti-protozoal activity).