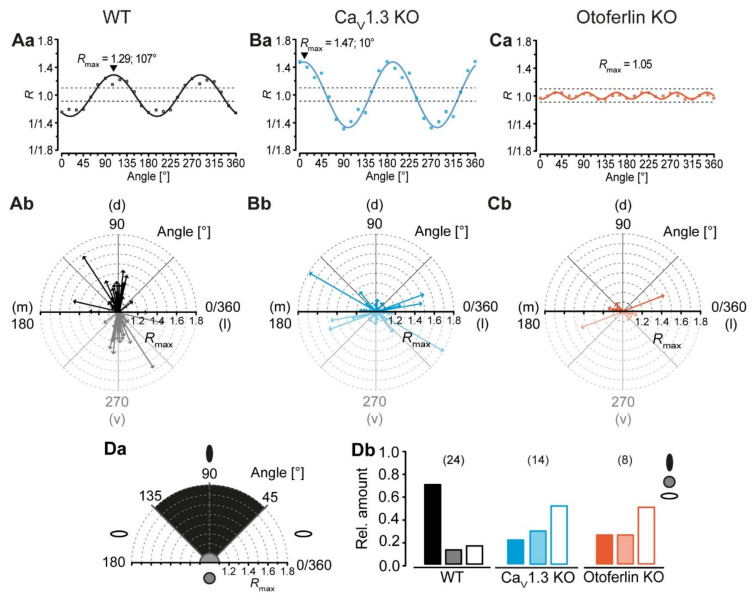
Figure 4.
LSO astrocyte networks show a disturbed topography in CaV1.3 KO and otoferlin KO mice. (A–C), analysis of network topography. The coordinate system was step wise rotated and the ratio of tracer extent was calculated using the vector means approach. The anisotropy and orientation of networks in the center of the LSO were determined using a sinusoidal function (Aa–Ca). Shown, are representative sinusoidal fits of the anisotropic networks that were oriented orthogonally (WT; Aa) and parallel to the tonotopic axis (CaV1.3 KO; Ba) as well as a fit of an isotropic network with no preferential orientation (otoferlin KO; Ca). (Aa–Ca) refer to networks shown in Figure 3Aa–Cd. Radar diagrams displaying the anisotropy (Rmax > 1.1: anisotropic; Rmax ≤ 1.1: isotropic) and orientation α of tracer-coupled networks (Ab–Cb). The mediolateral (m-l) axis resembles the tonotopic axis, the dorsoventral (d–v) axis resembles the orientation of isofrequency bands, which are oriented orthogonal to the tonotopic axis. In WT mice, most tracer-coupled networks showed a preferential orientation orthogonal to the tonotopic axis (d–v; 45 ≤ α < 135°) (Ab). In contrast, the majority of anisotropic astrocyte networks in CaV1.3 KOs and otoferlin KOs were aligned parallel to the tonotopic axis (m-l; α < 45° and α ≥ 135°) (Bb–Cb). (D), classification of networks. Astrocyte networks were affiliated to three classes by their shape Rmax and orientation α (class 1, black ellipse: anisotropic and oriented orthogonally to tonotopic axis; class 2, grey circle: isotropic; class 3: anisotropic and oriented parallel to the tonotopic axis; Da). In WT mice, most LSO astrocyte networks were categorized into class 1. In contrast, tracer-coupled networks in KOs were predominantly affiliated to class 3 (Db). The WT data (Aa–Ab) were already part of the following study: [9]. Panel Ab was reused from that publication.

