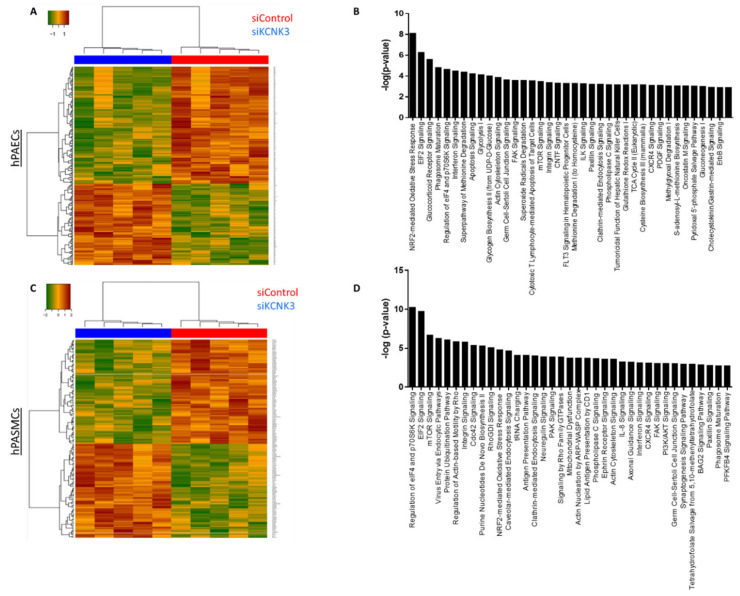
Figure 4.
Heatmap of the proteomic results and pathways deregulated in siKCNK3 hPASMCs and hPAECs. (A) Heatmap representation for proteomic results in hPAECs. hPAECs from the same patient between the siControl and siKCNK3 conditions are clustering together. (B) Representation of the 37 major pathways dysregulated in siKCNK3 hPAECs found with IPA (Ingenuity Pathway Analysis) software. (C) Heatmap representation of proteomic results in hPASMCs. hPASMCs from the same patient between the siControl and siKCNK3 conditions are clustering together. (D) Representation of the 37 major pathways dysregulated in hPASMCs transfected with siKCNK3 found with the Ingenuity Pathway Analysis (IPA) software.

