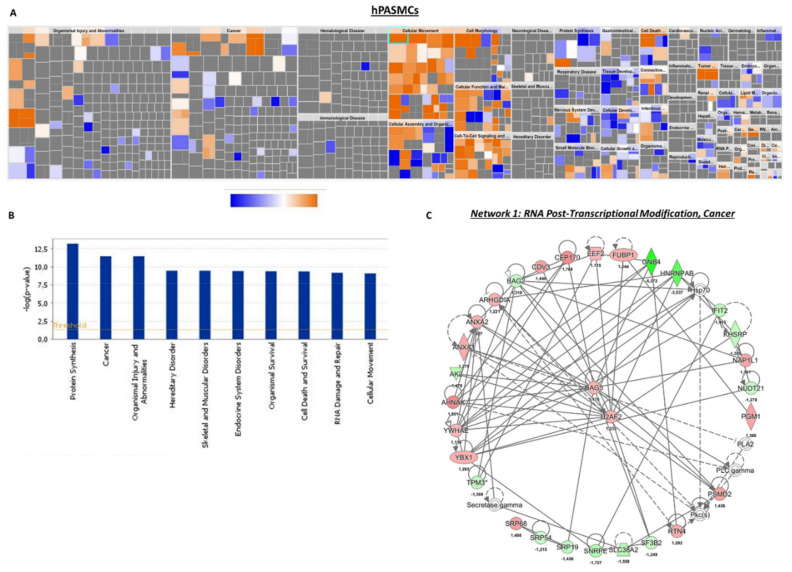
Figure 6.
Deregulated biological functions in KCNK3-knockdown hPASMCs and the protein network of interactions. (A) Heatmap representing the up-regulated (orange) or down-regulated (blue) biological functions in hPASMCs transfected with siKCNK3. (B) Histogram representing the 10 first deregulated biological functions in hPASMCs transfected with siKCNK3, classified according to –log (p-value). (C) Representation of the dysregulated network 1: RNA post-transcriptional modifications, cancer, and hematological disease. Red proteins are up-regulated proteins and green proteins are down-regulated proteins.

