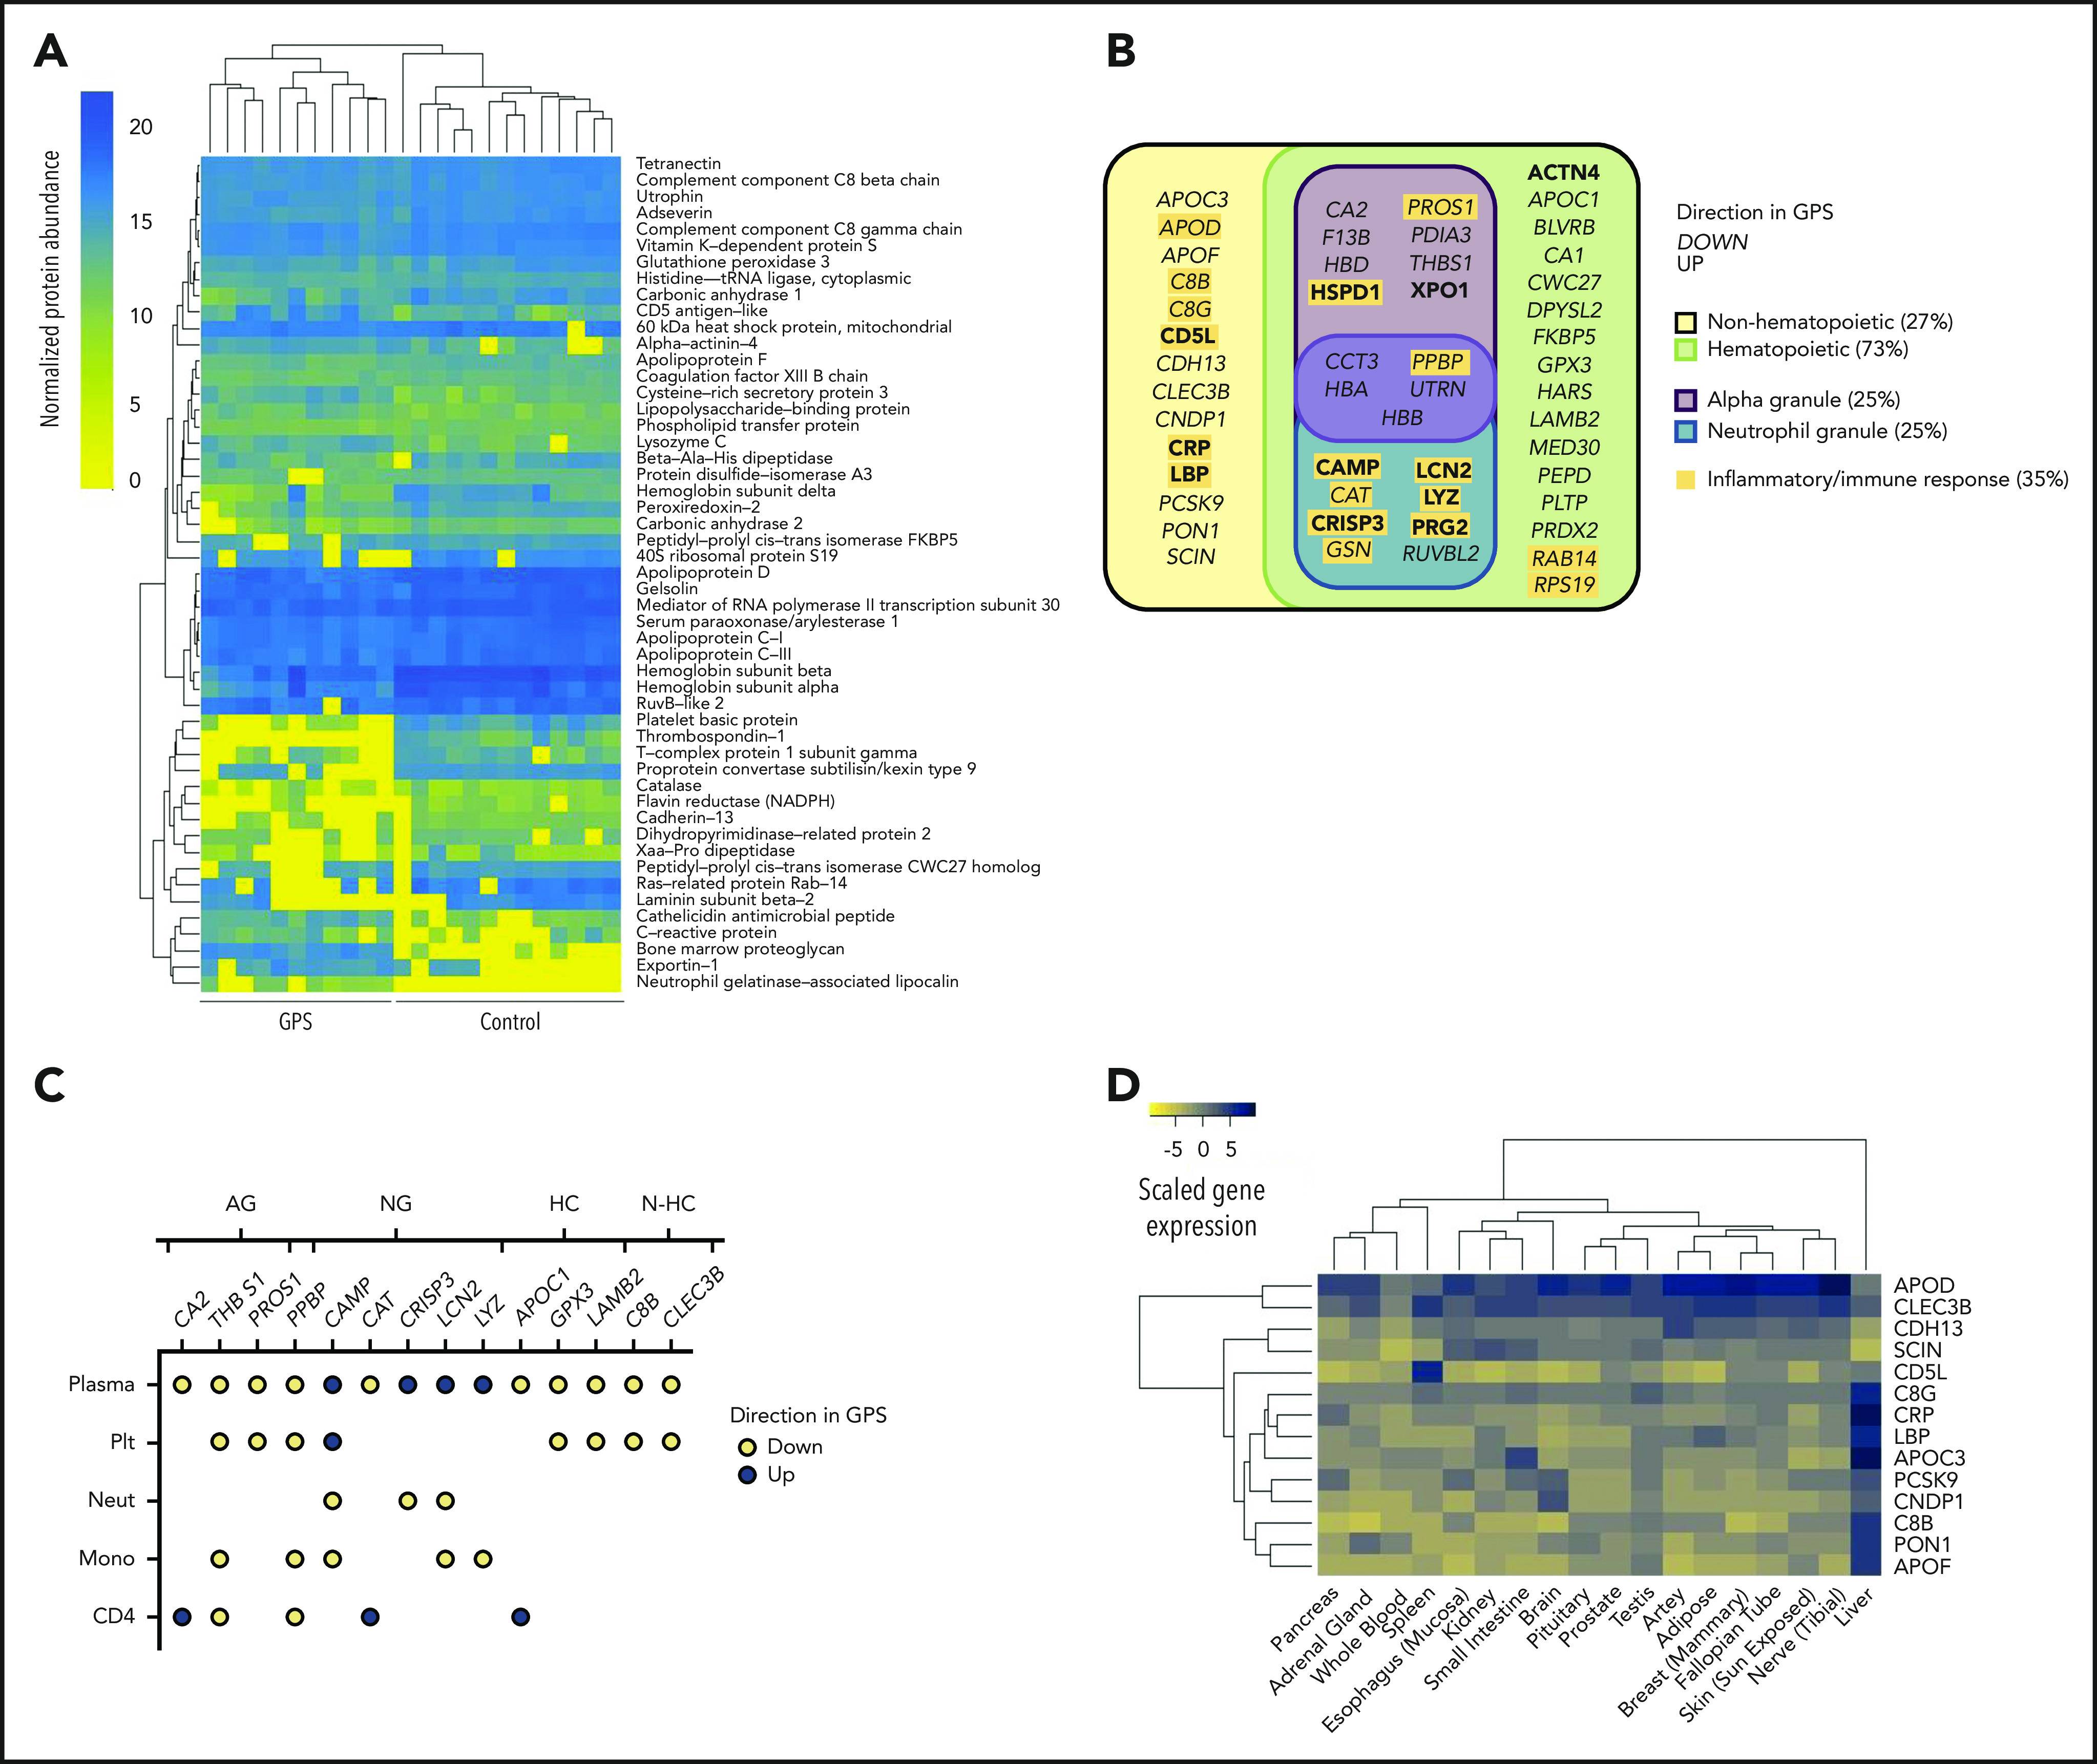
Figure 4.

The GPS plasma proteome. (A) A heatmap of normalized protein abundance of the 51 discriminatory proteins detected in plasma from 11 patients with GPS and 13 control subjects, which showed segregation by unsupervised clustering. Each column represents an individual GPS patient or control subjects. (B) Classification of the 51 discriminatory proteins of the plasma proteome by directionality in GPS plasma, cellular origin (hematopoietic or nonhematopoietic), and subcellular localization (platelet α or neutrophil granules). Proteins involved in inflammatory or immune responses are highlighted in yellow. (C) A dot plot representing the 14 discriminatory plasma proteins that are also differentially abundant proteins in at least one of the cell types evaluated by using Sequential Window Acquisition of All Theoretical Mass Spectra-Mass Spectrometry (platelets [Plt], neutrophils [Neut], monocytes [Mono], and CD4 lymphocytes [CD4]). Each data point represents a protein and is color-coded according to its directionality in the respective proteome. Absence of a protein in an explicit cell-specific proteome denotes a protein that was determined not to be differentially abundant. Proteins are annotated by granule localization (AG = platelet α granule, NG = neutrophil granule) or, for proteins not localized in granules, gene expression in hematopoietic cells (HC) or non-hematopoietic cells (N-HC) in the BLUEPRINT consortium atlas.51 (D) A heatmap showing the gene expression of the 14 discriminatory plasma proteins of nonhematopoietic origin in the Genotype-Tissue Expression Project.52,53 Scaled gene expression represents log2 transformation of transcripts per million base pairs mapped.
