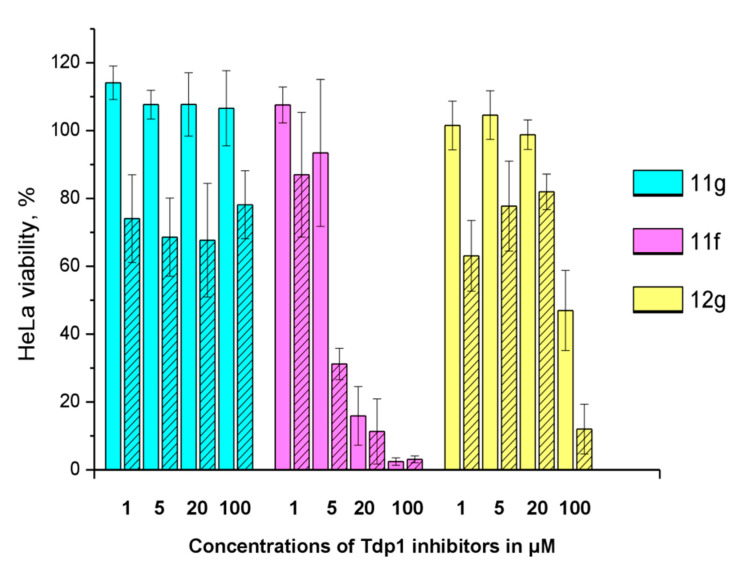
Figure 5.
The influence of 2 μM topotecan on Tdp1 inhibitors’ cytotoxicity. The unshaded histogram bars denote cell viability in the presence of a Tdp1 inhibitor. The hatched histogram bars indicate cell viability in the presence of a combination of a Tdp1 inhibitor with 2 μM of topotecan. The concentration of the Tdp1 inhibitor in μM is given under each pair of bars. Error bars show standard deviations.

