Figure 1.
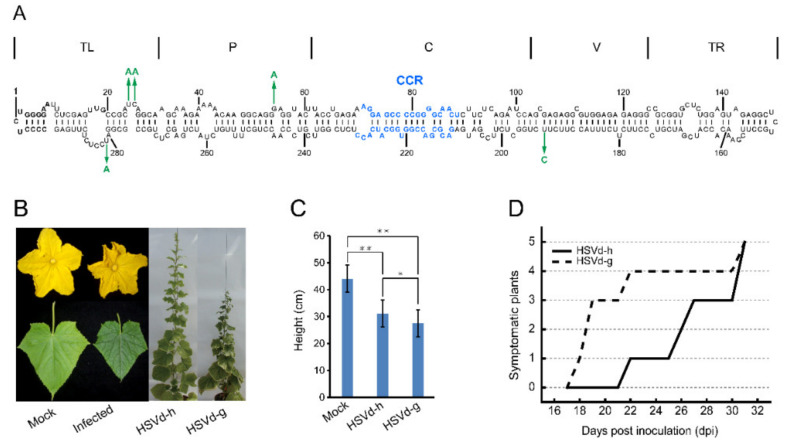
Symptoms of HSVd-g and HSVd-h infection in cucumbers. (A) The predicted secondary structure of HSVd-g. The five hop-adaptive mutations between HSVd-g and HSVd-h are indicated by green arrows. From left to right, the five structural/functional domains are terminal left (TL), pathogenicity(P), central (C), variable (V), and terminal right (TR). Central conserved region (CCR) in central domain is indicated by blue color. (B) Symptoms on cucumber at 28 days post-inoculation (dpi); left to right, flower, and leaf from healthy plant, flower, and leaf from the infected plant by HSVd-g or HSVd-h, and whole plants infected with HSVd-h or HSVd-g showing shortened internodes at 49 dpi. (C) Average height (n = 6) of cucumber plants infected with HSVd-h or HSVd-g at 32 dpi. Single or double asterisks indicate statistically significant differences at p < 0.05 or 0.01, respectively, in Student’s t-test. (D) Time course of symptom expression in cucumbers; solid and dashed lines show a number of symptomatic plants inoculated with HSVd-h or HSVd-g, respectively.

