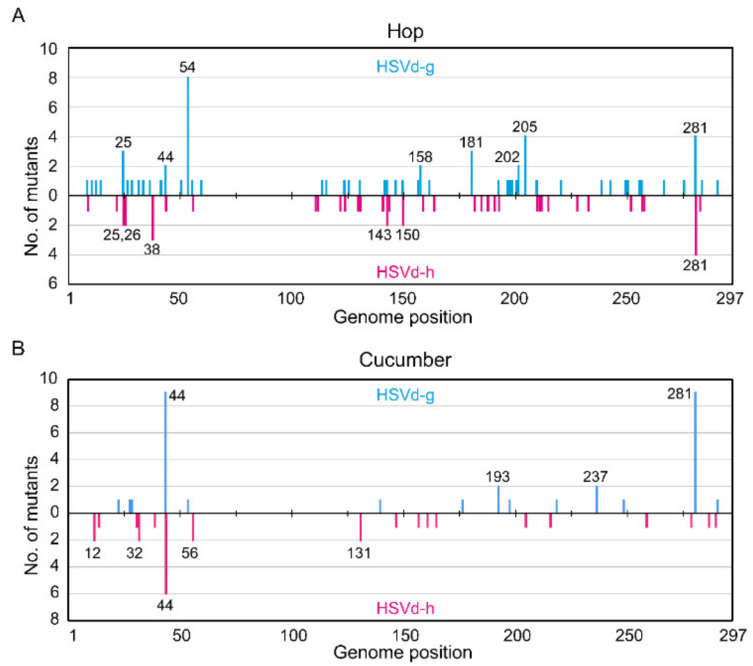
Figure 4.
Frequency of mutations in HSVd during the initial stage of replication in (A) hop (the second growing season) and (B) cucumber (the second passage) plants. The vertical axis indicates the number of cDNA clones containing mutation(s). The numbers of cDNA clones with mutations were plotted along the linearized HSVd genome. Blue bars indicate mutations found in HSVd-g, and red bars indicate those in HSVd-h. The numbers above the bars indicate the nucleotide position of HSVd.

