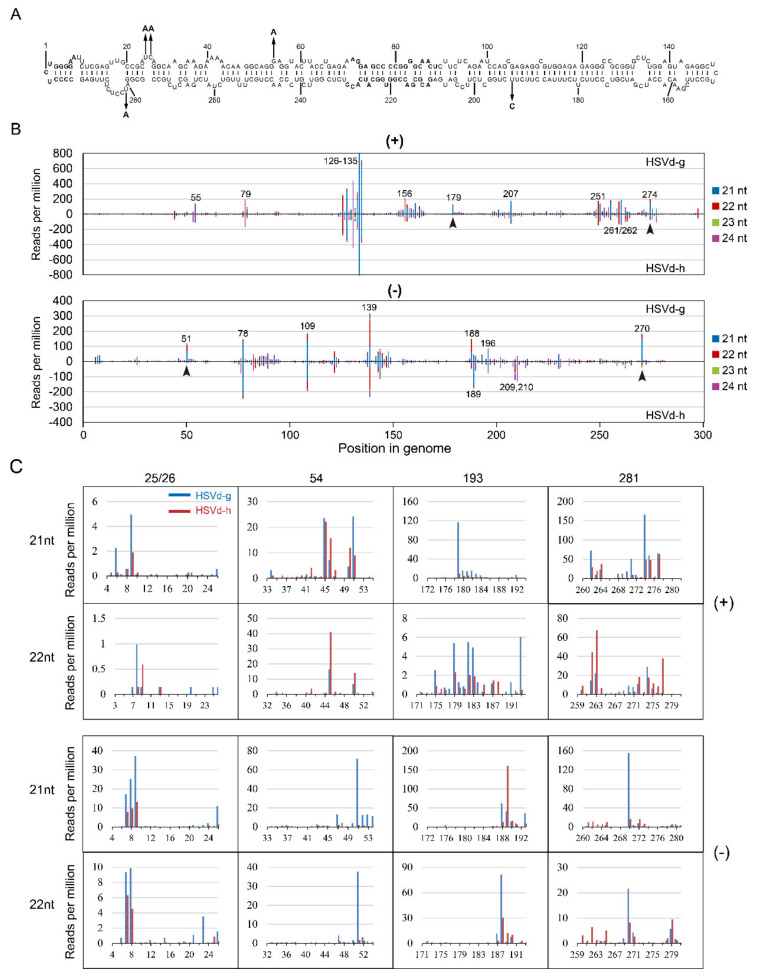
Figure 7.
Sequence profiles of HSVd-sRNA derived from the genomic (+) and anti-genomic (−)-strands of HSVd-g or HSVd-h in cucumbers. The top panel (A) shows the predicted secondary structure of HSVd-g. The five hop-adaptive mutations between HSVd-g and HSVd-h are indicated by the arrows. sRNA distribution profiles shown in panel (B) represent the sum of 21–24-nt HSVd-sRNA populations recovered from cucumber plants infected with HSVd-h or HSVd-g plotted along the linearized HSVd genome (nucleotides 1–297 from left to right). sRNA distribution profiles of HSVd-g and HSVd-h are compared for genomic (upper panel) and anti-genomic (lower panel) strands. Genome positions of selected hot-spot peaks are marked by corresponding numbers. Arrowheads indicate sRNAs containing adaptive mutations that distinguish HSVd-g from HSVd-h and accumulate to obviously different levels. Details of their amounts and sequences are shown in panel (C).

