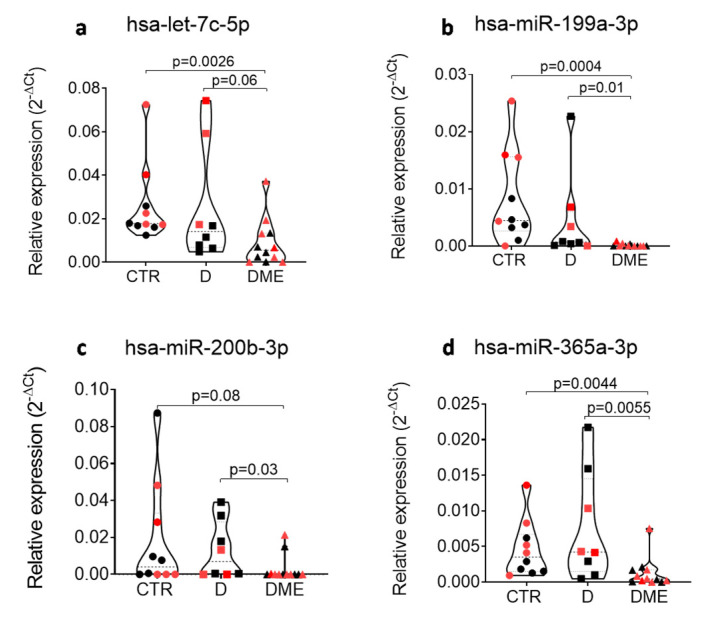
Figure 5.
The expression of hsa-let-7c-5p (a), hsa-miR-199a-3p (b), hsa-miR-200b-3p (c) and hsa-miR-365-3p (d) is reduced in AH of DME vs CTR and/or vs D patients after testing for all subjects included in the study (n = 10 CTR, n = 8 D, n = 12 DME). Profiling cohort (n = 5 CTR, n = 5 D, n = 5 DME) is indicated with black dots, while the additional validation cohort (n = 5 CTR, n = 3 D, n = 7 DME) is shown as red dots. microRNA expression values are reported as 2−ΔCT normalized for the expression of hsa-miR-150-5p. Median values for each group are shown as dotted line alongside with quartiles (smaller dotted lines). p-values were considered significant with p < 0.05 using Mann–Whitney U Test.

