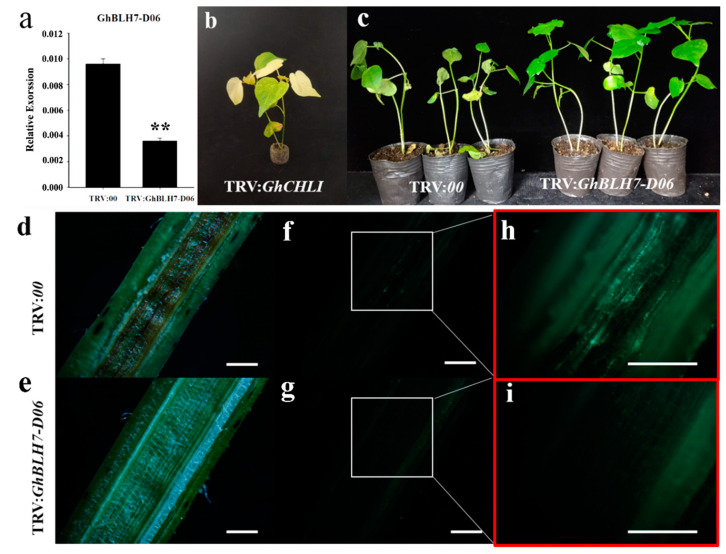
Figure 3.
Phenotypic identification and analysis of GhBLH7-D06 VIGS cotton: (a) silencing efficiency of VIGS test of GhBLH7-D06; (b) phenotype of VIGS positive control plants; (c) phenotype observation of GhBLH7-D06 VIGS plants and wild type control plants after two weeks of V. dahliae (Vd991-GFP) infection; and (d–i) observation of epicotyl longitudinal sections of GhBLH7-D06-silenced plants and control plants, Scale bars = 1.0 mm. Error bars represent the standard deviation of three biological replicates. Asterisks indicate statistically significant differences, as determined by Student’s t-test (** p < 0.01).

