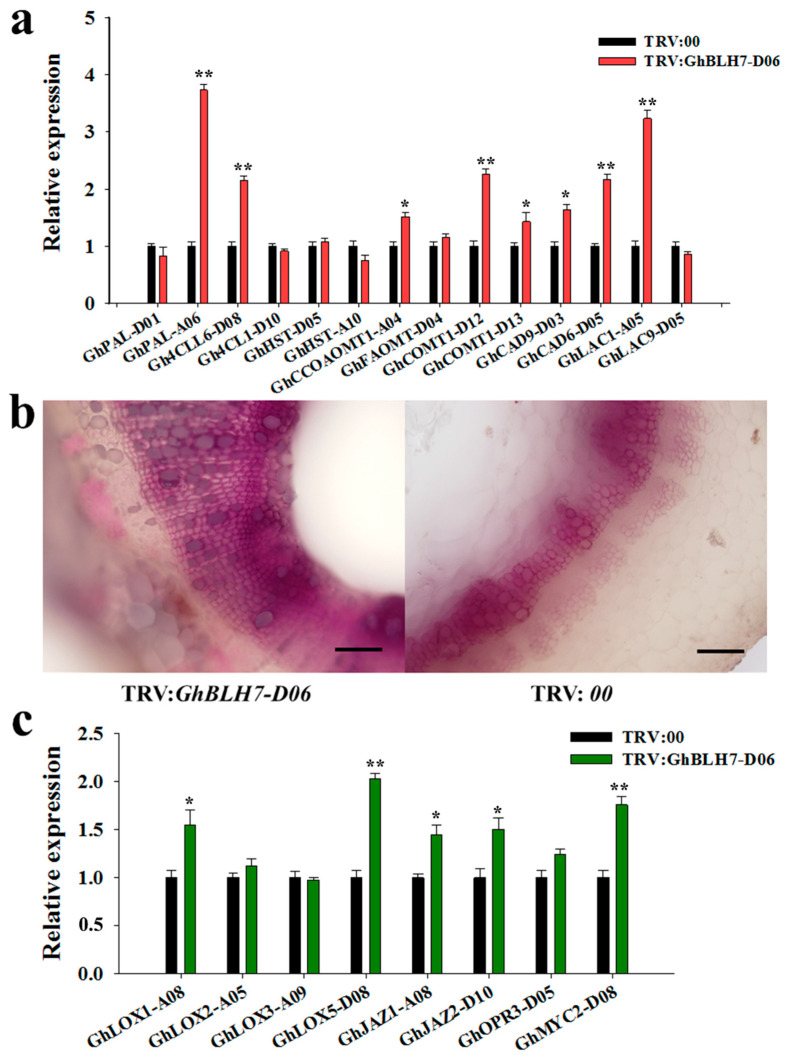
Figure 4.
Observation and detection of lignin components in GhBLH7-D06-silenced plants and control plants: (a) expression analysis of lignin synthesis-related genes in GhBLH7-D06-silenced plants and control plants; (b) observation of lignin phloroglucinol staining sections of GhBLH7-D06-silenced plants and control plants (scale bars = 0.1 mm); and (c) expression analysis of JA signaling pathway genes in GhBLH7-D06-silenced plants and control plants. Error bars represent the standard deviation of three biological replicates. Asterisks indicate statistically significant differences, as determined by Student’s t-test (* p < 0.05; ** p < 0.01).

