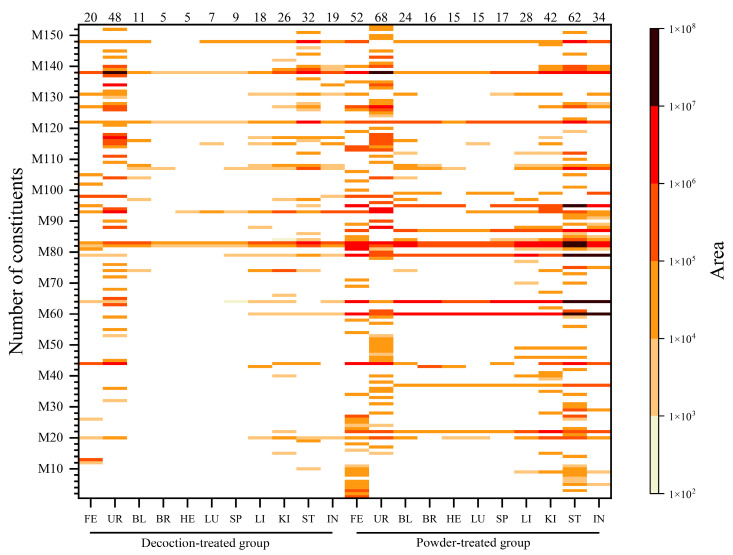
Figure 3.
Heatmap of identified compounds. Peak area of compounds identified in feces, urine, blood, and eight organ samples (brain, heart, lung, spleen, liver, kidney, stomach, and small intestine) are illustrated using heatmaps, in which the color shade (shown in the right of the ordinate) indicates the peak area size of a compound. Darker band indicates a larger peak area. Serial numbers of compounds (shown on the ordinate) were sorted by the retention time of all compounds identified in each sample, and the larger the compound number, the higher the polarity. Numbers of compounds identified in each sample are shown above the horizontal axis. FE: feces; UR: urine; BL: blood; BR: brain; HE: heart; LU: lung; SP: spleen; LI: liver; KI: kidney; ST: stomach; IN: small intestine.

