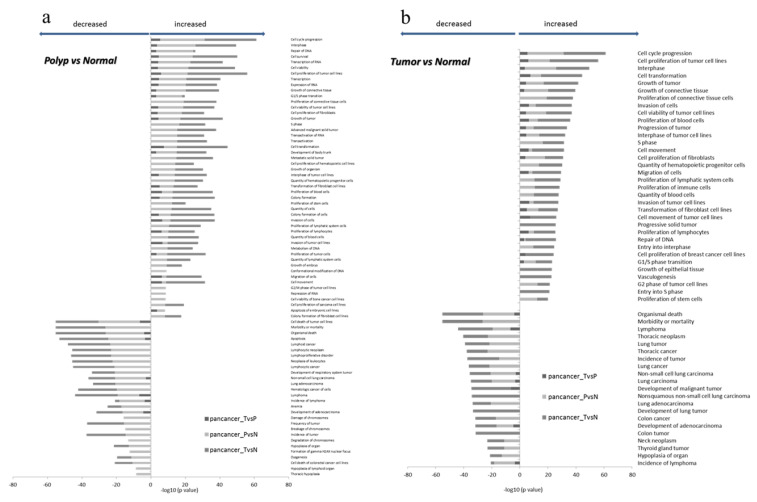
Figure 2.
Bar chart representing the top comparing categories obtained by the functional enrichment analysis performed on differentially expressed genes. The top of decreased (Z-scores < −2) and increased functions (Z-scores > 2) was resulted by comparing polyps vs normal tissues (a) and tumors vs normal tissues (b).

