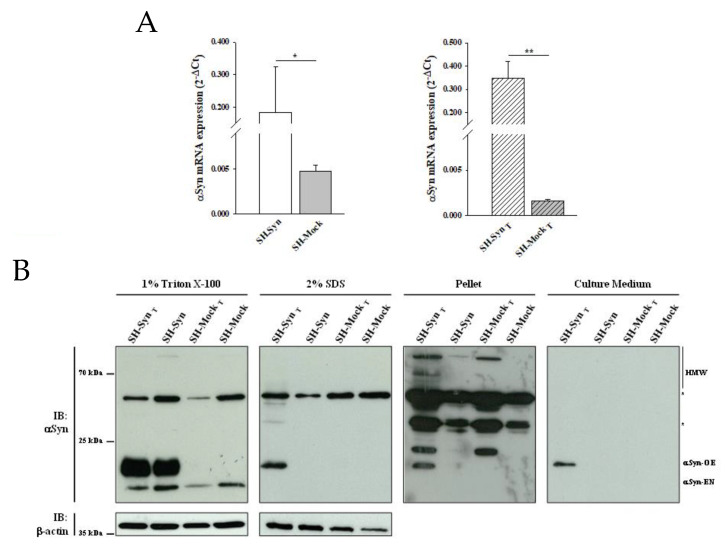
Figure 1.
αSynuclein (αSyn) expression in SH-SY5Y cells stably overexpressing αSyn (SH-Syn) and SH-SynT. (A) αSyn mRNA quantification by qPCR in SH-Syn and control cells (SH-Mock) (left panel) and in SH-SynT and SH-MockT (right panel). Data are presented as the means ± SD from three independent experiments, each performed in duplicate. Data were analyzed by a two-tailed Student t-test (* p < 0.05; ** p < 0.001). (B) Detection of αSyn in the 1% Triton X-100 soluble fraction, in the 2% SDS soluble fraction, in the pellet fraction, and in the cell culture medium of SH-Syn, SH-SynT, SH-Mock, and SH-MockT. Blots are representative of experiments repeated three times. β-actin was used as the loading control; an asterisk represents non-specific bands.

