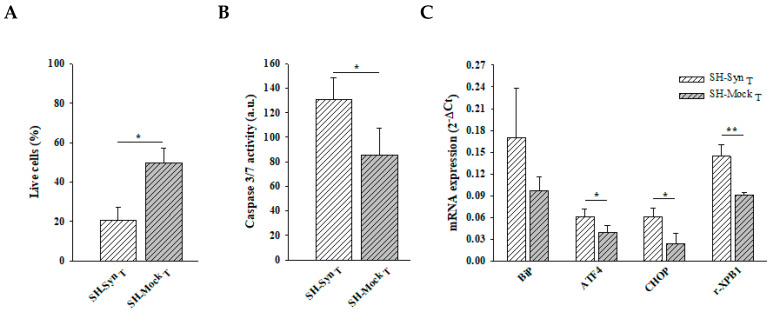
Figure 3.
Cell viability, executioner 3/7 caspase activity, and UPR induction in SH-SynT. (A) Live cell count by Trypan blue staining of SH-SynT and SH-MockT. Data are presented as the means ± SD from three independent experiments, each performed in triplicate. Data were analyzed by a two-tailed Student’s t-test (* p < 0.05). (B) Analysis of caspase 3/7 activity in SH-SynT and SH-MockT. Data are presented as the means ± SD from two independent experiments, each performed in triplicate. Data were analyzed by a two-tailed Student’s t-test (* p < 0.05). (C) BiP, ATF4, CHOP, and r-XBP1 mRNA quantification by qPCR in SH-SynT and SH-MockT. Data are presented as the mean ± SD of three independent experiments, each performed in duplicate. Data were analyzed by a Mann–Whitney Rank Sum Test (* p < 0.05, ** p < 0.001).

