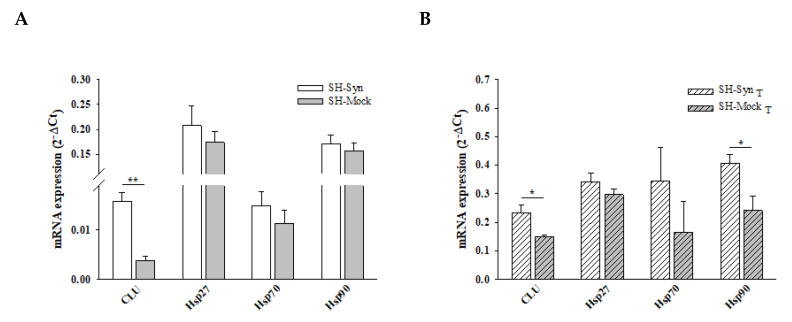
Figure 4.
Chaperones mRNA level in SH-Syn and SH-SynT. (A) CLU, Hsp27, Hsp70, and Hsp90 mRNA quantification by qPCR in SH-Syn and SH-Mock. (B) CLU, Hsp27, Hsp70, and Hsp90 mRNA quantification by qPCR in SH-SynT and SH-MockT. Data are presented as the mean ± SD of three independent experiments, each performed in duplicate. Data were analyzed by a Mann–Whitney Rank Sum Test (* p < 0.05, ** p < 0.001).

