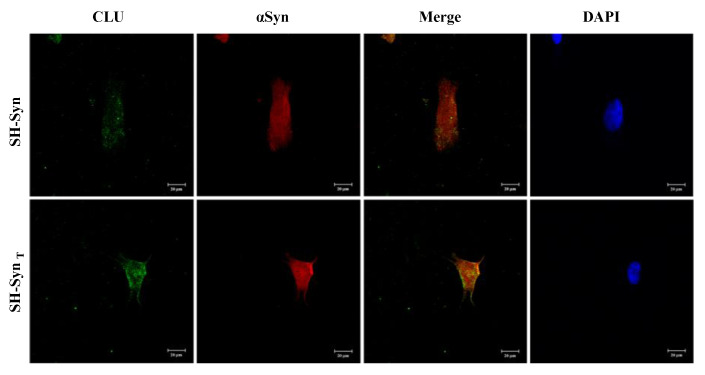
Figure 6.
Localization of CLU and αSyn in SH-Syn and SH-SynT. Representative images of the intracellular localization of CLU (green fluorescence) and αSyn (red fluorescence) in SH-Syn and SH-SynT acquired by confocal microscopy. Cell nuclei were stained with 4′dye-6˗diamidino˗2˗phenylindole (DAPI, blue fluorescence). Magnification 40×.

