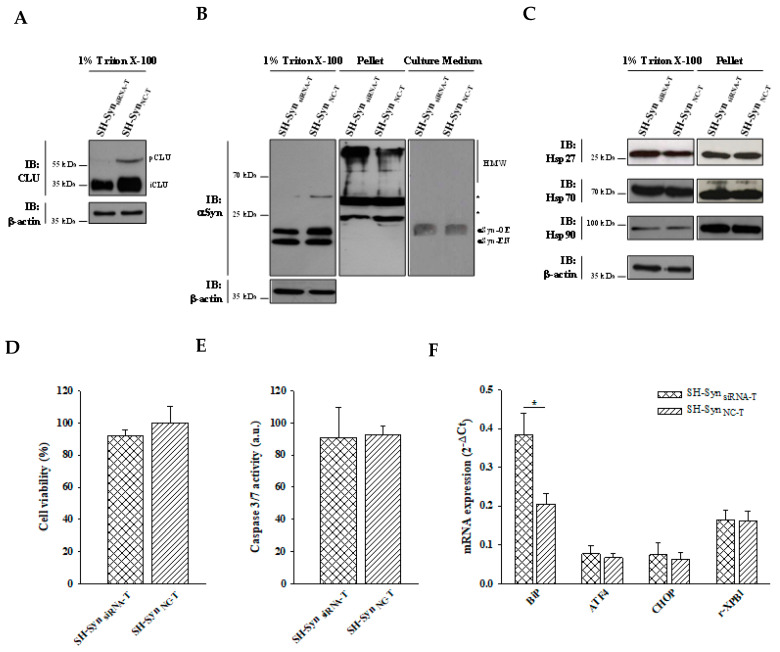
Figure 9.
Effects of CLU down-regulation in SH-SynT. (A) Detection of CLU in the 1% Triton X-100 soluble fraction of SH-SynsiRNA-T and SH-SynNC-T. Blots are representative of experiments repeated three times. β-actin was used as the loading control. (B) Detection of αSyn in the 1% Triton X-100 soluble fraction, in the pellet fraction, and in the culture medium of SH-SynsiRNA-T and SH-SynNC-T. Blots are representative of experiments repeated two times. β-actin was used as the loading control; an asterisk represents non-specific bands. (C) Detection of Hsp27, Hsp70, and Hsp90 in the 1% Triton X-100 soluble fraction and in the pellet fraction of SH-SynsiRNA-T and SH-SynNC-T. Blots are representative of experiments repeated three times. β-actin was used as the loading control. (D) The cell viability of SH-SynsiRNA-T and SH-SynNC-T by the WST-1 assay. Data are shown as the mean ± SD of two independent experiments, each performed in triplicate. The differences between groups are not statistically significant. (E) Analysis of caspase 3/7 activity in SH-SynsiRNA-T and SH-SynNC-T. Data are presented as the mean ± SD of two independent experiments, each performed in triplicate. The difference between groups is not statistically significant. (F) BiP, ATF4, CHOP, and r-XBP1 mRNA quantification by qPCR in SH-SynsiRNA-T and SH-SynNC-T. Data are presented as the mean ± SD of two independent experiments, each performed in duplicate. Data were analyzed by a Mann–Whitney Rank Sum Test (* p < 0.05).

