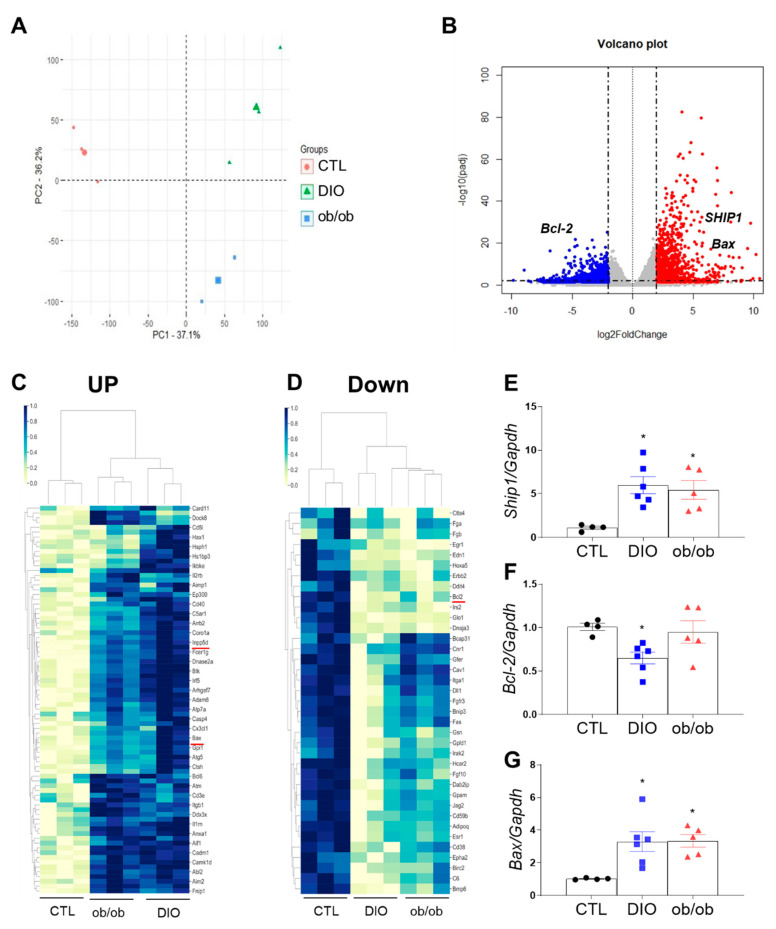
Figure 2.
RNA-seq analysis of adipose tissue. (A) Principal component analysis for 9 samples from CTL, DIO, and ob/ob mice (3 replicates for each group). (B) Volcano plot shows the differential gene expressions as blue and red dots (|fold change| < 1.60). (C,D) Cluster map of differential gene expression related to immune system and apoptosis showing upregulated (C) and downregulated genes (D) in CTL mice relative to DIO or ob/ob mice. (E–G) Quantitative RT-PCR analysis of Src homology domain-containing inositol 5′-phosphatase 1 (Ship1) (E), Bcl-2 (F), and Bax (G). Data are presented as the means ± SEM; * p < 0.05 versus CTL mice. CTL (black circle), DIO (blue square), ob/ob (red triangle).

