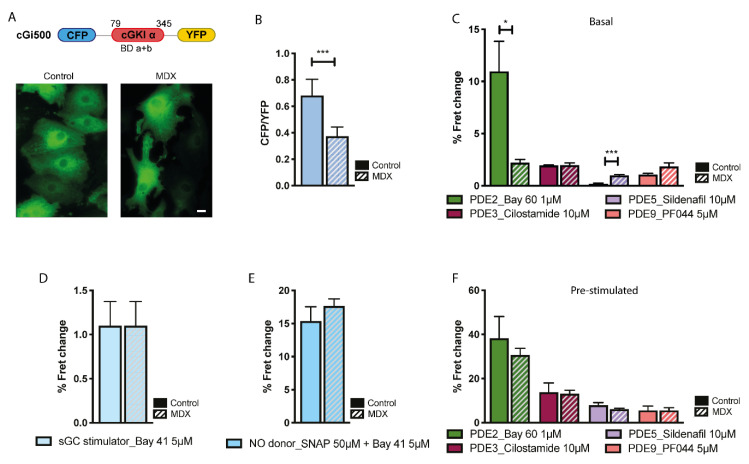
Figure 1.
Comparison of cGMP signals in the bulk cytosol of neonatal ventricular myocytes (NVM) from control and mdx mice. (A) Top: schematic representation of the cytosolic cGMP fluorescence resonance energy transfer (FRET) reporter cGi500. Bottom: representative image of control and mdx NVM expressing cGi500. (B) Mean relative values for CFP to YFP fluorescence intensity ratio recorded in unstimulated NVM from control and mdx mice expressing cGi500. n = 4. (C) Mean FRET change recorded in NVM on application of family-selective cGMP-PDE inhibitors as indicated. n = 4. (D) Mean FRET change recorded in NVM from control or mdx mice on application of the cGC stimulator Bay-41. n = 2. (E) Mean FRET change recorded in NVM from control or mdx mice on application the NO donor SNAP in combination with the cGC stimulator Bay-41. n = 4. (F) Mean FRET change recorded in NVM on application of family-selective cGMP-PDE inhibitors as indicated in cells pre-treated as in (E) n = 4. For all data, mean ± SEM are shown. * = 0.01 ≤ p ≤ 0.05, *** = p < 0.001. Size bar: 10 µm.

