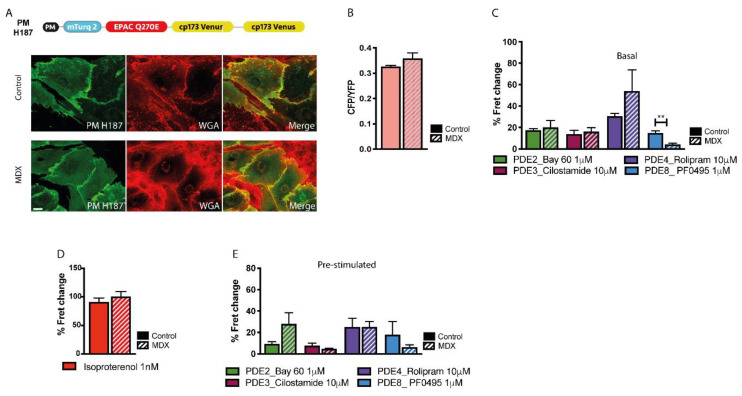
Figure 5.
Comparison of cAMP signals at the plasmalemma of NVM from control and mdx mice. (A) Top: schematic representation of the plasmalemma-targeted cAMP FRET reporter PM-H187. PM, plasma-membrane targeting domain. Bottom: left, representative images of control and mdx NVM expressing PM-H187. Co-staining with the plasma membrane dye WGA is shown in the central panel and the overlay is shown on the right. (B) Mean relative values for CFP to YFP fluorescence intensity ratio recorded in unstimulated NVM from control and mdx mice expressing PM-H187. n = 4. (C) Mean FRET change recorded in NVM expressing PM-H187 on application of family-selective cAMP-PDE inhibitors as indicated. n = 4. (D) Mean FRET change recorded in NVM from control or mdx mice expressing PM-H187 on application of ISO 1 nM. n = 4. (E) Mean FRET change recorded in NVM expressing PM-H187 on application of family-selective cAMP-PDE inhibitors, as indicated, in cells pre-treated with ISO 1 nM. n = 4. For all data, mean ± SEM are shown. ** = 0.001 ≤ p < 0.01. Size bar: 10 µm.

