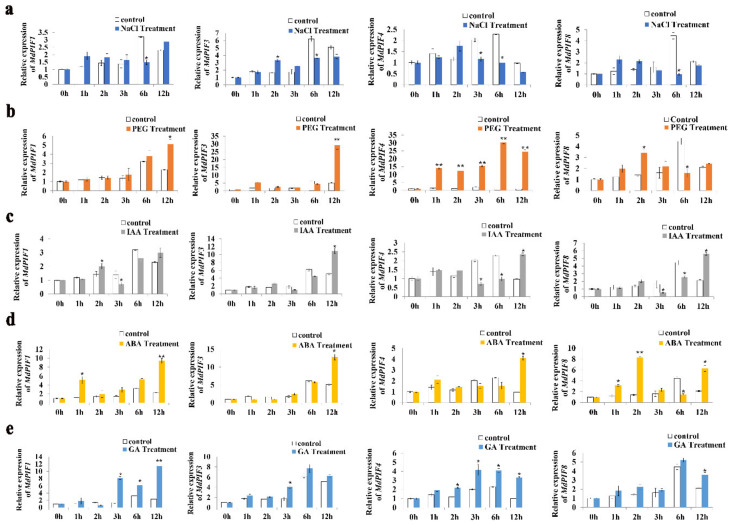
Figure 6.
Expression analysis of MdPIF genes in response to abiotic stressors and hormones. Expression levels of the MdPIFs in response to NaCl (a), PEG 6000 (b), indole-3-acetic acid (IAA) (c), ABA (d), and GA (e). Data are mean ± SD of three independent replicates. Asterisks denote significant differences from control (*, p < 0.05; **, p < 0.01).

