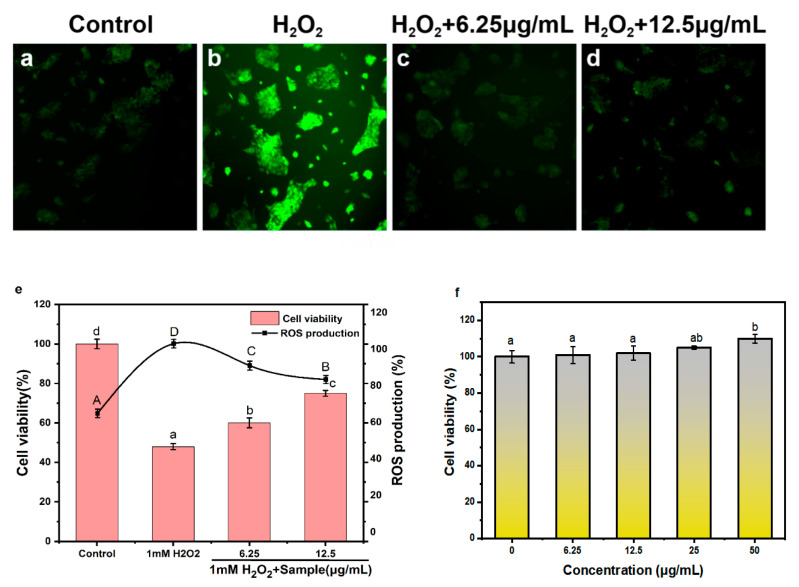
Figure 5.
Antioxidant activity and cytotoxicity of HaCaT keratinocytes. (a–d) Fluorescent images of HaCaT keratinocytes treated with H2O2 and PPNPS (1:8) and stained with H2DCFDA probe. (e) Cell viability and relative fluorescence intensity of HaCaT keratinocytes treated with H2O2 and PPNPS (1:8, w/w) at different concentrations. (f) Cytotoxicity of HaCaT keratinocytes treated with PPNPS (1:8, w/w) at different concentrations. Data are expressed as the mean ± SD. Multiple group comparisons were performed using one-way ANOVA; data that are not denoted with the same letter are significantly different (p < 0.05).

