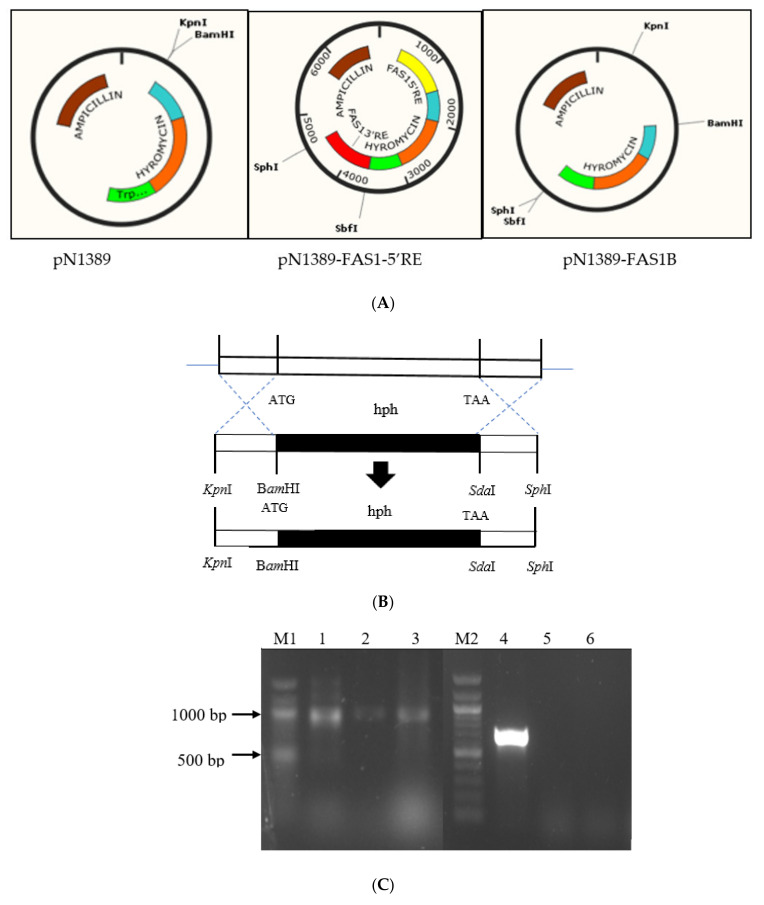
Figure 4.
Schematic presentation of the FAS1 gene deletion process through homologous double crossover to generate the pN1389-FAS1 construct. Validation of putative transformants and protein visualization is provided. (A) Schematic diagram outlining the ligation of 5′ FAS1 and 3′ FAS1 with restriction sites into pN1389 plasmids. (B) Assembly of pN1389-FAS1-5′RE and pN1389-FAS1 formation. (C) Validation of mutants with hygromycin and fas1 gene primers. Lane M1 and M2: 1 kb ladder (Biolab, England), (a) Lane 1: pN1389 plasmid as a positive control (~1000 bp), (b) Lane 2: Transformant fas1-1 amplified with hygromycin primers (~1000 bp), (c) Lane 3: Transformant fas1-2 amplified with hygromycin primers (~1000 bp), (d) Lane 4: Genomic DNA wildtype amplified with fas1 gene primers (700 bp), (e) Lane 5: Transformant fas1-1 amplified with fas1 gene primers (no results), (f) Lane 6: Transformant fas1-2 amplified with fas1 gene primers (no results). Protein visualization via SDS-PAGE provided in the Supplementary Figure S4.

