Figure 5.
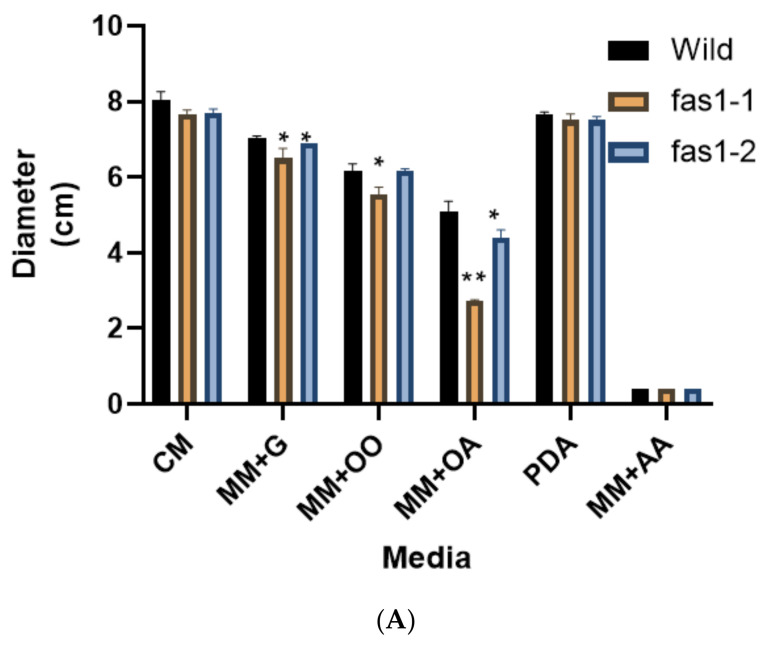
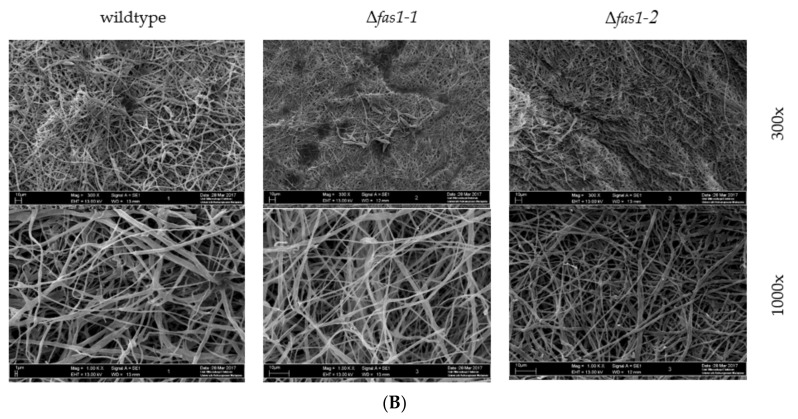
Growth rate and mycelial structure under scanning electron microscope (SEM). (A) Growth rate on different carbon source of wildtype, fas1-1 and fas1-2 after 10 days of incubation on complete medium agar plates at 26 °C. Error bars represent the standard deviation. Single asterisk represents significant difference (p ≤ 0.05). Double asterisks represent significant difference (p ≤ 0.01). (B) image of wildtype, fas1-1 and fas1-2 mycelium structure after 10 days of incubation on complete medium at temperature of 26 °C. Magnification 300× and 1000× taken using SEM.


