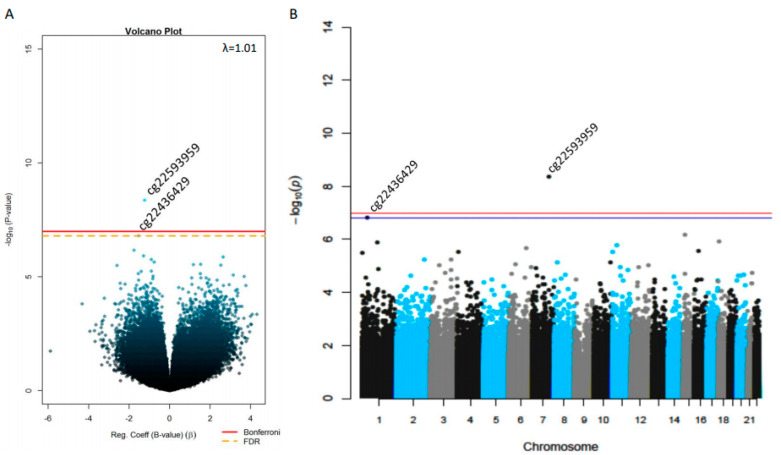
Figure 1.
Epigenome-wide single-site associations between placental DNAm levels and childhood adiposity. (A) Volcano plot and (B) Manhattan plot shows the CpG-by-CpG analysis results of investigations between placental DNAm levels and children’s sum of skinfolds (subscapular + tricipital) in Gen3G participants. The False Discovery Rate (FDR) correction for multiple testing threshold (q < 0.05) is represented by a yellow doted-line in the Volcano plot and a blue line in the Manhattan plot, whilst the red line is the Bonferroni-corrected threshold (p < 1 × 10⁻⁷) in both graphs.

