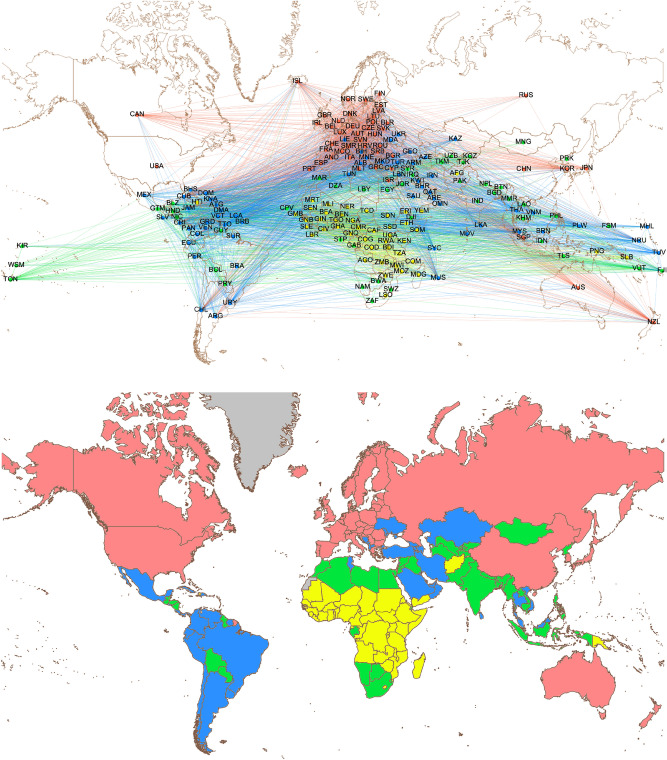
Figure 1.
WDI network and communities. Upper panel: 2018 WDI complex network, with nodes representing UN countries and edge weights obtained from their pairwise Pearson correlation; only links with weight exceeding 0.65 are displayed. Countries on the map are labelled by their ISO 3166-1 alpha-3 codes61. Colors of nodes and intra-community edges are determined by the community to which they belong (red for community I, blue for II, green for III, yellow for IV), while edges connecting nodes from different communities take their color from the first node in alphabetical order. Lower panel: Geographical distribution of the four communities of the WDI complex network. States and territories not considered in the analysis are colored in grey. Maps are generated with the “Map of Countries” and “GeoLayout” plugins of Gephi 0.9.262.

