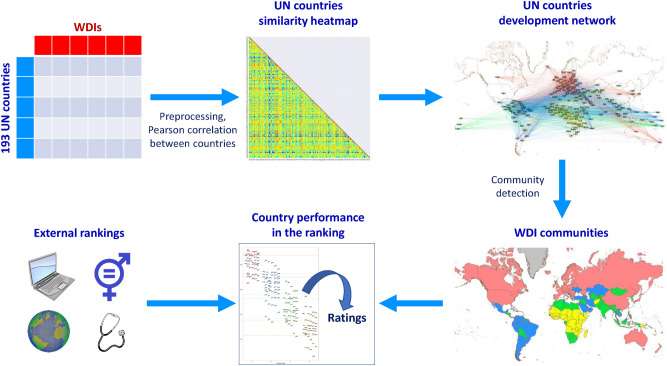
Figure 5.
Scheme representing the pipeline of the analysis. A portion of WDI database17,76 is selected according to availability criteria. A complex network describing similarity of countries is obtained from pairwise Pearson correlations between their WDIs, after rescaling each WDI in [0, 1]. Community detection results are compared with index rankings with resolution ratio , in order to evaluate performances of countries according to their development status. Maps are generated with the “Map of Countries” and “GeoLayout” plugins of Gephi 0.9.262.

