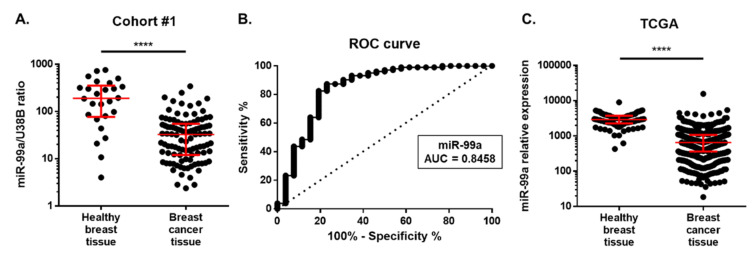
Figure 2.
(A) MiR-99a expression levels in breast cancer tissues from Cohort #1. Differential miR-99a expression levels in 103 breast cancer tissues were compared with 26 normal breast tissues. Red horizontal line: median with interquartile range. Mann–Whitney U, **** p < 0.0001. (B) Receiver-operating characteristic (ROC) curve analysis for miR-99a expression levels in breast cancer tissue samples. (C) TCGA data for the expression of miR-99a-5p in normal solid tissue (n = 52) and breast primary tumour (n = 782). Expression is represented as reads per million miRNA mapped. Horizontal line: median with interquartile range. Mann–Whitney U, **** p < 0.0001.

