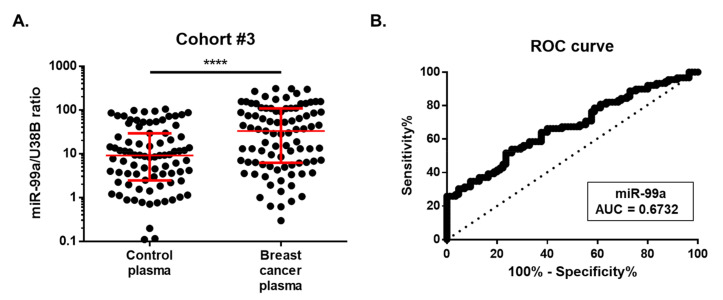
Figure 4.
(A) Circulating miR-99a levels in cohort #3. Differential miR-99a levels in plasma of 89 breast cancer patients were compared with those of 85 healthy controls. Expression levels were significantly lower in healthy controls than in breast cancer patients. Red horizontal line: median with interquartile range. Mann–Whitney U, **** p < 0.0001. (B) Receiver-operating characteristic (ROC) curve analysis for circulating miR-99a levels in cohort #3.

