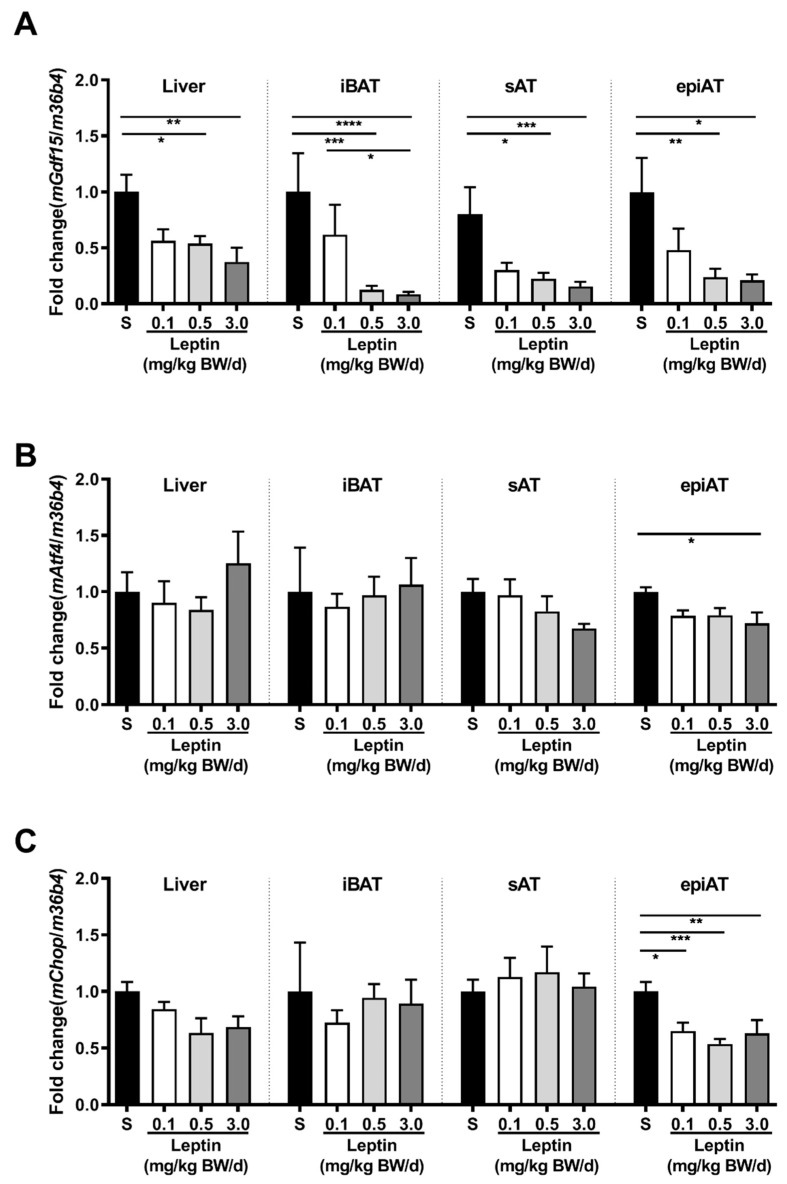
Figure 2.
Effect of leptin treatment (0.1, 0.5, and 3.0 mg/kg BW/d) on Gdf15 (A), Aft4 (B), and Chop (C) mRNA expression relative to 36B4 (n ≥ 8 per group) in liver, intrascapular brown (iBAT), subcutaneous (sAT), and epididymal (epiAT) adipose tissue of LDLR-/-;ob/ob animals. Data are presented as means ± SEM. Differences were assessed by one-way ANOVA corrected by Bonferroni–Holm. * indicates p < 0.05, ** p < 0.01, *** p < 0.001, **** p < 0.0001.

