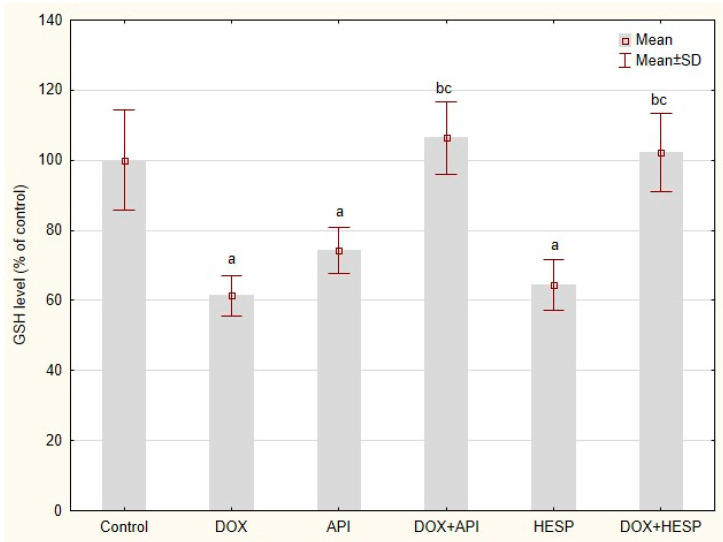
Figure 7.
The GSH level in MCF-7 cells, presented as a % of a control. The cells were treated for 48 h with 1 µM of doxorubicin (DOX) and 50 μM of apigenin (API)/50 μM of hesperidin or combined (DOX + API, DOX + HESP). The values obtained from 3 independent experiments were presented as mean ± SD. a p < 0.05 vs. control, b p < 0.05 vs. DOX, c p < 0.05 vs. apigenin/hesperidin.

