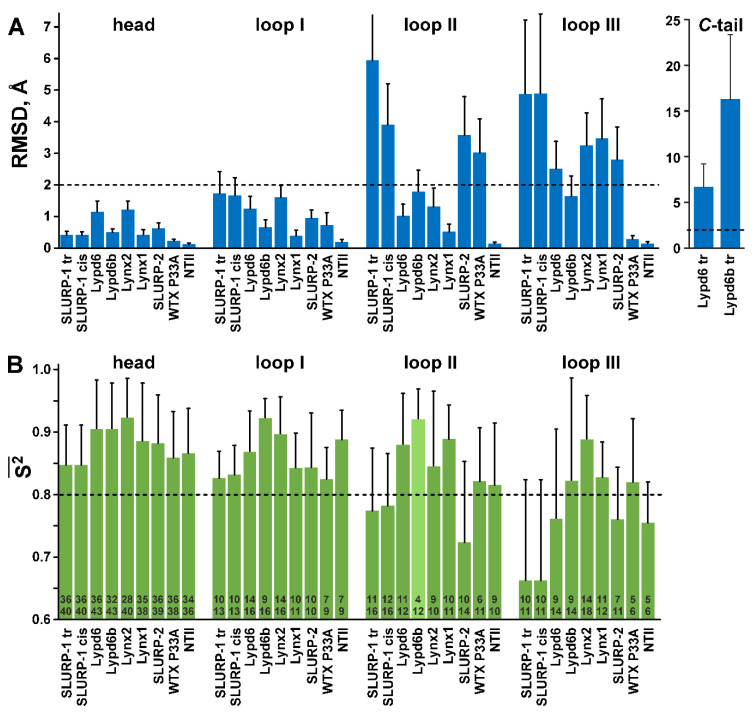
Figure 3.
Qualitative comparison of NMR structure precision (A) with amplitude of ps–ns dynamics (B). (A). Mean backbone RMSD values (Å) in the NMR sets of the TFPs structures calculated over the loop regions, C-terminal ‘tail,’ and ‘head’ (other residues). The boundaries of the loop and C-terminal regions in the protein sequences are shown in Figure 1 with a gray background. Threshold value (RMSD > 2.0 Å, dashed line) shows the protein fragments with significant disorder. (B). Mean generalized order parameters (S2) calculated over the loop regions, and ‘head’ of TFPs. The calculation of S2 values in the C-terminal ‘tails’ was impossible, probably due to a very complex mobility model of the corresponding residues, which cannot be adequately described by models ##1–5. The threshold value (S2 < 0.8, dashed line) shows the protein fragments with high-amplitude ps–ns dynamics. The numbers within the bars denote the length of the corresponding region (lower number) and number of residues with 15N relaxation data available (upper number). The mean S2 value in the Lypd6b loop II (light green) has the large degree of uncertainty due to lack of experimental data.

