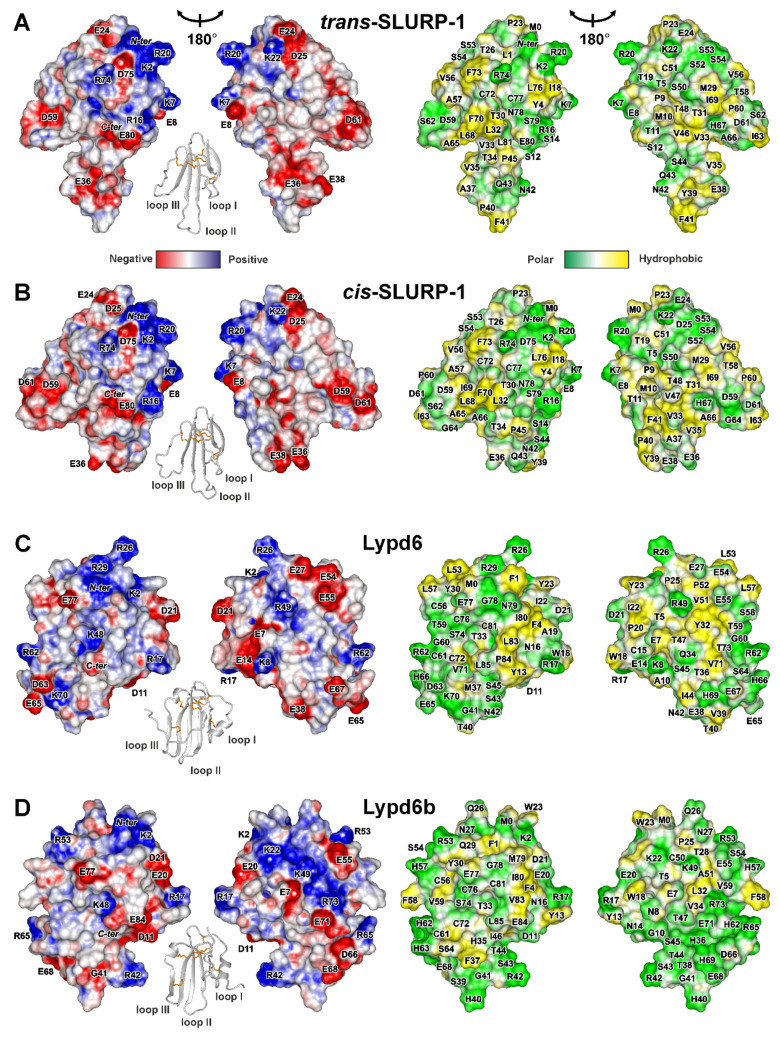
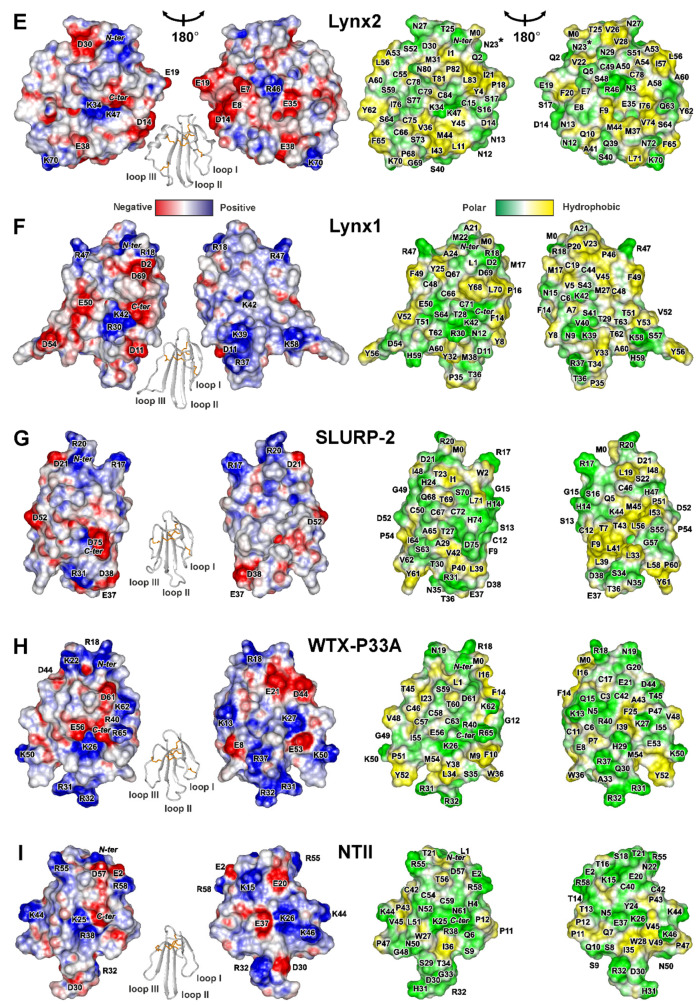
Figure 4.
Two-sided view of molecular surfaces of TFPs: (A) trans-Tyr39-Pro40 SLURP-1, (B) cis-Tyr39-Pro40 SLURP-1, (C) Lypd6, (D) Lypd6b, (E) Lynx2, (F) Lynx1, (G) SLURP-2, (H) WTX-P33A, (I) NTII. Electrostatic and molecular hydrophobicity [67] potentials are shown. Red, blue, green, and yellow areas denote negative, positive, polar, and hydrophobic regions, respectively. The ribbon representation shown for each protein/isomer corresponds to the left panel. The predicted glycosylation site (Asn23) in the Lynx2 molecule is shown by asterisk.


