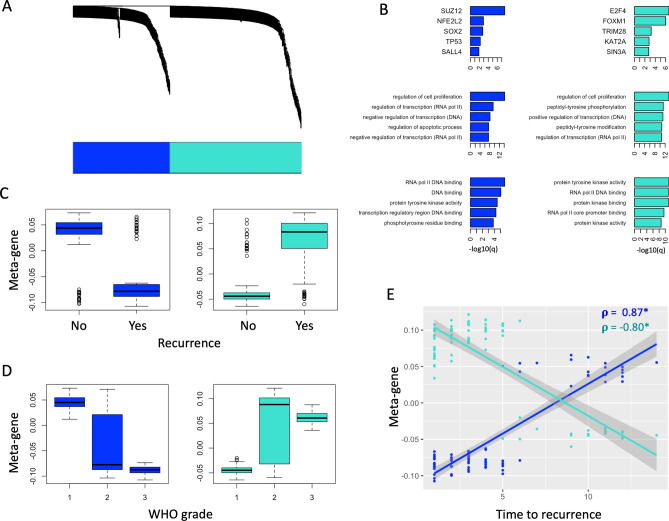
Figure 1.
Gene module detection and characterization. (A) Weighted gene co-expression network dendrogram demonstrates hierarchical clustering of individual genes. Module annotation of individual genes is represented by the colour bar, which reveals 2 significant modules (blue and turquoise). (B) Module gene lists are annotated using Enrichr. The top 5 transcription factors (ENCORE/CHEA consensus TFs) and entries for GO Biological Processes and GO Molecular Functions are represented in the top, middle, and bottom rows, respectively. Ranking is by − log10(q-value). Color corresponds to the module colour from (A). (C,D) Boxplots comparing meta-gene expression between recurrent and non-recurrent tumors (C) and WHO grades (D) for both modules. (E) Correlation between time to recurrence (years) and meta-gene expression of both modules. Pearson correlation is represented by . *p < 0.05.

