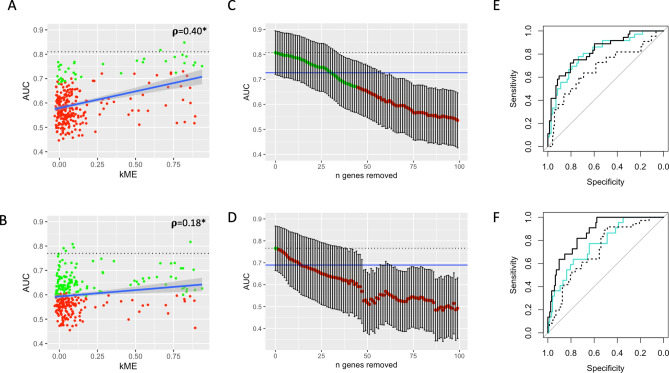
Figure 3.
E2F4/FOXM1-enriched module performance. (A,B) Correlation between kME (the correlation of a gene’s expression to the E2F4/FOXM1-enriched module meta-gene) and the recurrence predictive accuracies (AUCs) of the module’s constituent genes as assessed in validation cohorts 1 (A) and 2 (B). The interrupted black line represents the module metagene performance. Green points represent genes that whose ROC curves are similar to the module metagene (DeLong’s p > 0.05), while red points represent genes which are significantly different (DeLong’s p < 0.05). (C,D) AUCs of ROC curves generated from iteratively removing genes from the module in descending order of highest AUC in validation cohorts 1 (C) and 2 (D) as computed in (A,B) (and iteratively re-calculating the resultant meta-genes). A maximum of 100 top genes are removed from each cohort. Dotted lines and dot colors are as in (A,B). Blue line corresponds to 90% of the absolute AUC of the full model. Thirty of the top genes in validation cohort 1 must be removed before the updated module metagene yields an AUC less than 90% of the full model (sparse model 1), and thirteen in validation cohort 2 (sparse model 2). Notably, only two genes overlap between these sparse models. (E) ROC curves comparing the full model in validation cohort 1 (solid turquoise curve) to sparse model 1 (meta-gene of the 30 genes extracted above) on validation cohorts 1 (solid black curve) and 2 (broken black curve). All curves are statistically similar (DeLong’s p > 0.05). (F) ROC curves comparing the full module in validation cohort 2 (solid turquoise curve) to sparse model 2 (meta-gene of the 13 genes extracted above) on validation cohorts 2 (solid black curve) and 1 (broken black curve). The AUC of the solid black curve is significantly higher than the other two (DeLong’s p < 0.05).

