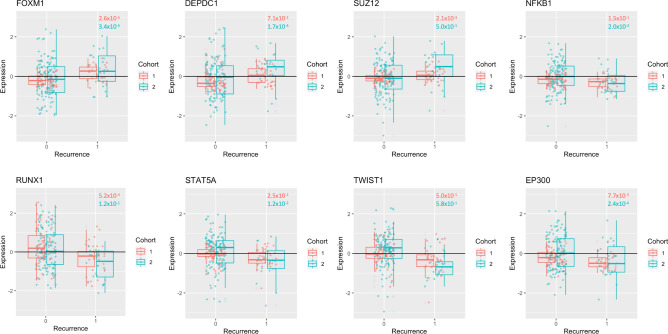
Figure 4.
Transcription factors associated with the E2F4-enriched module. Transcription factors with Enrichr q-value < 0.05 and t-test p < 0.05 between recurrent and non-recurrent tumors in both validation cohorts are included. Red corresponds to validation cohort 1 (microarray) and blue corresponds to validation cohort 2 (RNA-sequencing). ANOVA p-values for gene association with WHO grade are found on the plot, with colour corresponding to boxplot colours. Note that DEPDC1 and NFKB1 are not significantly associated with WHO grade in validation cohort 1, SUZ12 and RUNX1 are not significantly associated with WHO grade in validation cohort 2, and that TWIST1 is not significantly associated with WHO grade in either validation cohort.

