Figure 2.
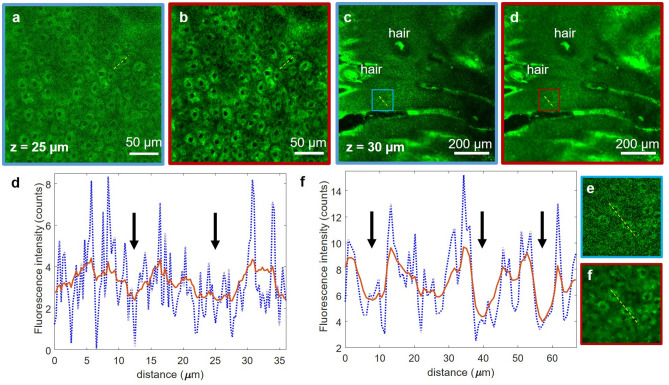
Performance of 2D CARE image restoration. Trained model is applied to images acquired by accumulating 15 consecutive frames of 0.27 × 0.27 mm2 (a) and 0.9 × 0.9 mm2 (c) image sequences (both 1 MPx, 2 s acquisition time). Restored images (b,d) display decreased noise levels and higher contrast for both fields of view. (e,f) line profiles through adjacent keratinocytes corresponding to (a,b) and (c,d) respectively (yellow lines). The line intensity profiles in the network prediction images (red) show enhanced definition of cell nuclei (black arrows) compared to the low cellular contrast to background in the raw images (blue). The insets in (g) and (h) are close-ups of the blue and red areas outlined in (c) and (d), respectively.

