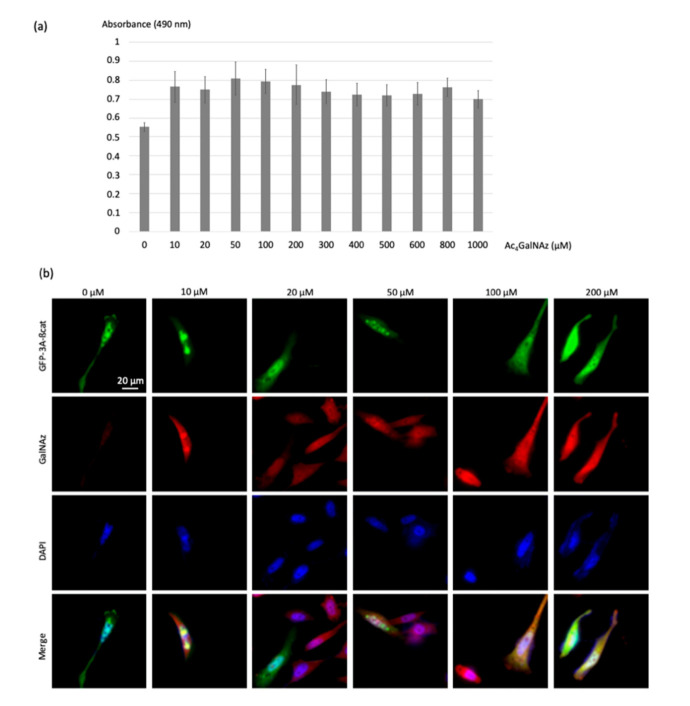
Figure 4.
Optimization of the concentration of the chemical reporter. (a) The histogram represents the cytotoxicity evaluation of the chemical reporter Ac4GalNAz; Hela cells were treated at a concentration of 0 to 1000 µM. Twenty-four hours later, the cell viability was determined using the MTS assay. (b) HeLa cells transfected with the GFP-3a-β-catenin expressing vectors were treated with increasing Ac4GalNAz concentration (10, 20, 50, 100, and 200 µM) and labeled with DBCO-cy3 (10 µM).

