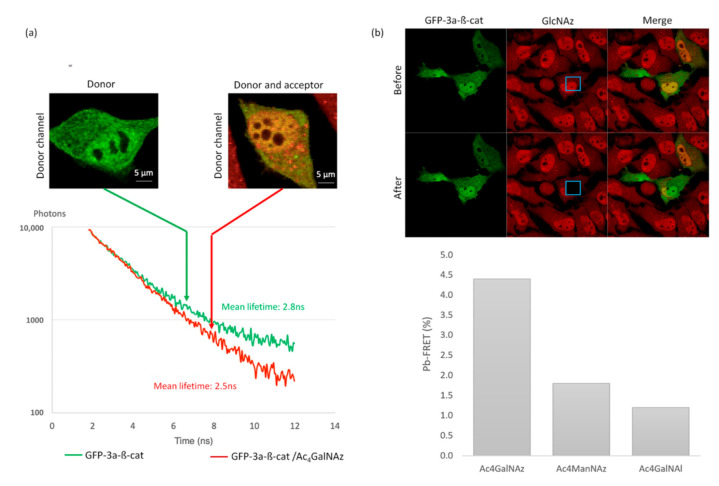
Figure 5.
Proof of feasibility: FRET imaging of O-GlcNAcylated GFP-3a-β-catenin. (a) SLiM-FRET experiment using two-photon excitation: representative photon decay curves and associated fluorescence mean lifetime extracted from only the GFP emission channel. (b) Donor dequenching after acceptor photobleaching. The inserted blue box indicates the photobleached area. Histograms correspond to calculated pb-FRET inside the cells after photobleaching in comparison to Ac4GalNAl and Ac4ManNAz, which serve as a negative control.

