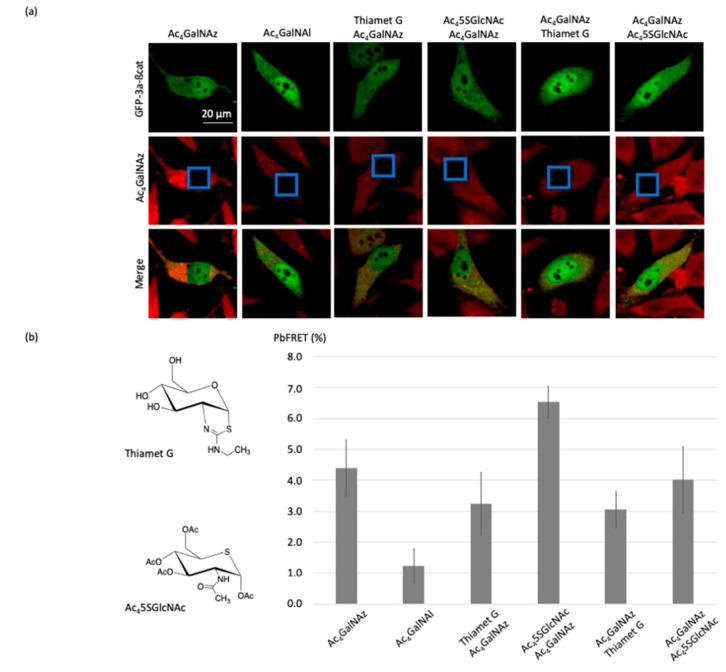
Figure 6.
Imaging the changes of pb-FRET for GFP-3a-β-catenin in HeLa cells induced by the OGT and OGA inhibitors. (a) Fluorescence images of the O-GlcNAcylated glycoform of β-catenin before and after photobleaching using Thiamet-G or Ac45SGlcNAc. (b) Histograms corresponding to calculated pb-FRET inside the cells after photobleaching using thiamet-G or Ac45SGlcNAc, whose structures are shown at the left.

