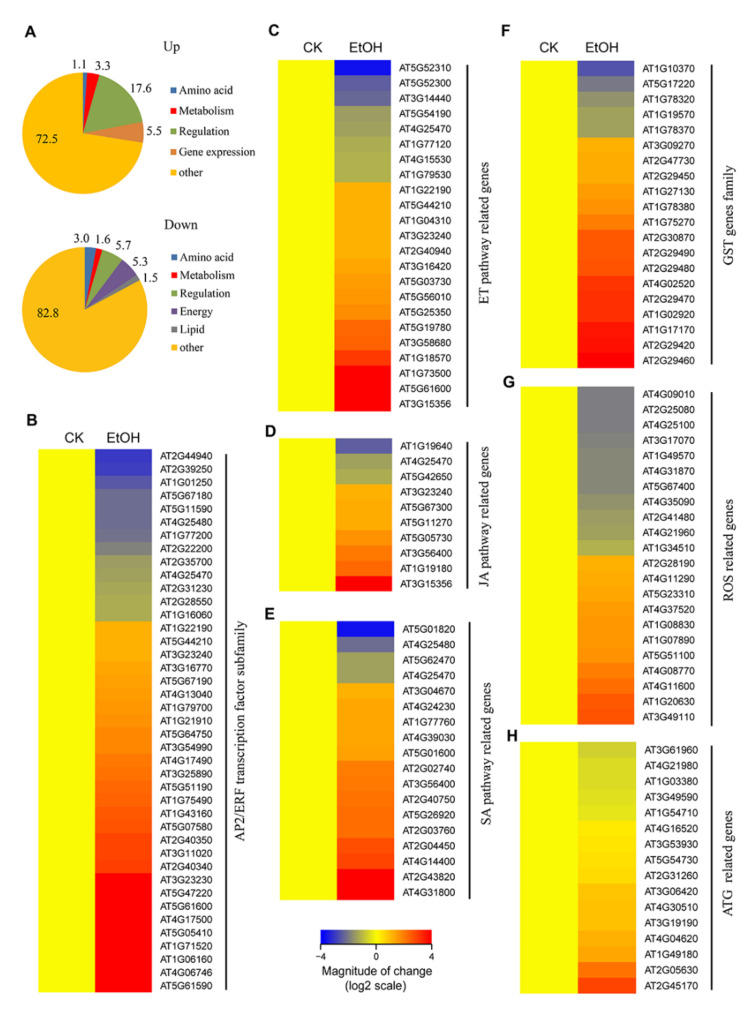
Figure 1.
Differentially expressed genes in response to ethanol treatment. (A) Functional annotation of 2487 upregulated and 1422 downregulated genes after ethanol treatment. (B) Hierarchical clustering of differentially expressed ethanol-responsive genes from the AP2/ERF transcription factor subfamily. (C,E) Hierarchical clustering of differentially expressed ethanol-responsive genes from the ethylene (ET, C), jasmonic acid (JA, D), and salicylic acid (SA, E) biosynthesis and signaling pathways. (F,H) Hierarchical clustering of differentially expressed ethanol-responsive genes from the glutathione S-transferase (GST, F) gene family, reactive oxygen species (ROS, G)- and autophagy (ATG, H)-related genes. The log2 fold change values of the transcriptional profiles were calculated using the R program heatmap 2.0. Red and blue represent up- and downregulated genes, respectively. Differentially expressed genes were identified based on the criteria FDR < 0.005 and FC ≥ 1.5 or FC ≤ 0.67.

