
Figure 4.
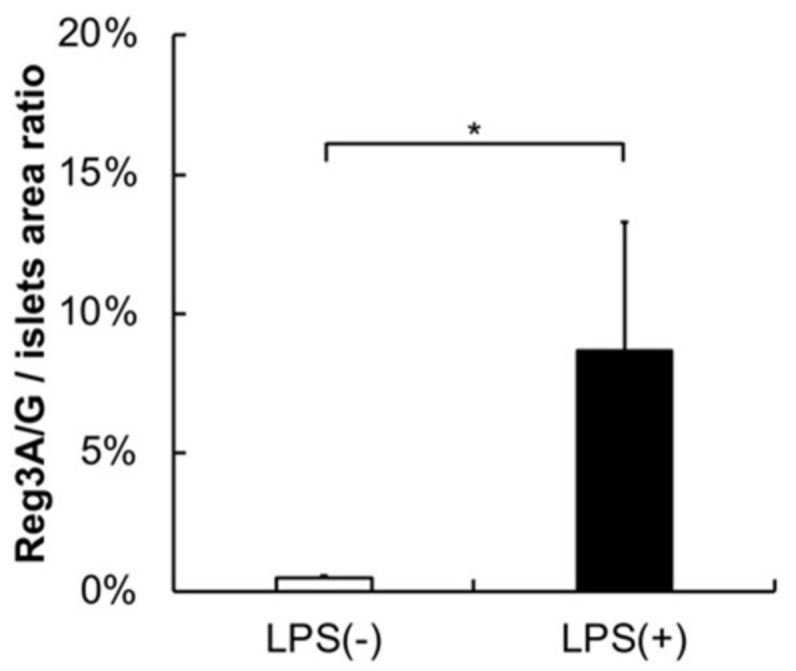
Reg3A/G/Islets area ratio from image analysis. Image analysis showed that the ratio of Reg3A/G-positive cells was significantly higher in the PG-LPS group than the control. Data are shown as mean ± standard deviation (SD), Mann–Whitney U test (* p ˂ 0.05; n = 5).