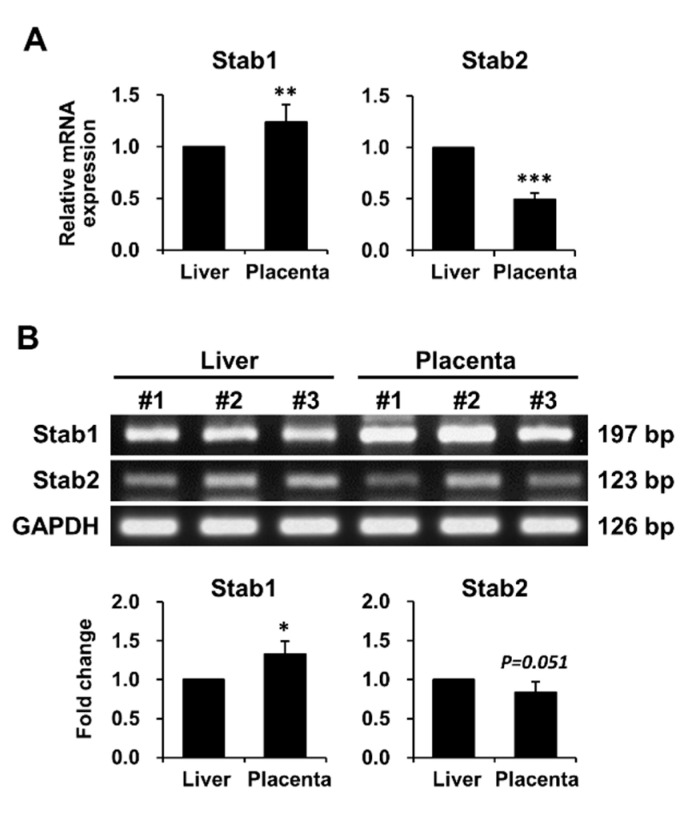
Figure 1.
mRNA expression levels of Stab1 and Stab2 in WT female mouse placentas. The mRNA expression levels of Stab1 and Stab2 in mouse placentas were measured using qPCR (A) and RT-PCR (B) and were compared with those in the liver used as a positive control. The relative expression levels shown in (A) were plotted against those of the respective genes in the liver, which were set to 1.0. Intensities of individual bands obtained via RT-PCR shown in (B) were determined using ImageJ. Data were normalized to Gapdh expression and calculated as fold change relative to the expression level in the liver, which was set to 1.0. Numbers in (B) indicate the representative mice used in the experiment. *, p < 0.05; **, p < 0.01; ***, p < 0.001 versus the positive control; n = 3.

