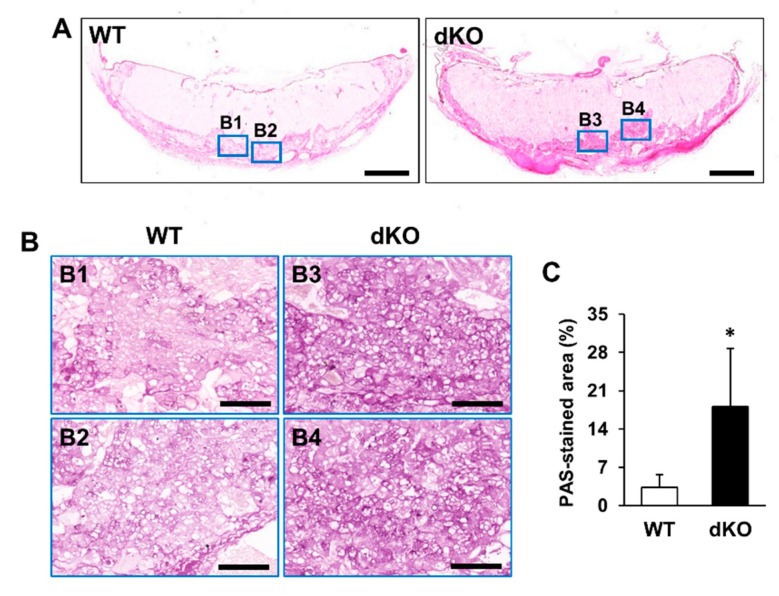
Figure 6.
Histological analysis of WT and Stab1/2 dKO placentas based on PAS staining. (A) Overall shape of the PAS-stained placentas derived from WT and Stab1/2 dKO mice. Scale bar, 1 mm. (B1–B4) High-magnification images of the blue rectangles in (A). Scale bar, 100 µm. (C) Percentage of PAS-stained positive area to the total tissue area was analyzed using ImageJ. *, p < 0.05 versus WT; n = 3.

